|
|
1.IntroductionA central goal in cancer research is the early and rapid identification of malignant cells, ideally free-flowing in biological fluids such as urine1 and blood.2,3 The properties of malignant cells are not fully understood, but what is known is that subgroups of cells within tumors play specific roles in the initiation and progress of metastasis, displaying aspects of pluripotency including unique cell adhesion receptors and ligands.4 Collecting and analyzing such cells could be useful in detection of patient response to therapy, monitoring of drug resistance effects, and early identification of disease recurrence.2,5–7 Analysis, capture, and propagation of a small number of cells would benefit from advancements in manipulating small volumes. Several microfluidic-based cell sorting techniques have been developed that rely on fluorescence, dielectric, or magnetic labeling to identify cell types. Separation is achieved using dielectrophoretic, magnetic, or mechanical techniques.8–11 Raman12,13 and surface-enhanced Raman spectroscopy (SERS) have been used as immunohistochemical tools14,15 for the detection of biomarkers in biological fluids or in vivo16 and for cancer detection from blood.17 Raman and Fourier transform infrared spectroscopy signals measured directly from cells are typically much weaker than those that are measurable with bright labels such as SERS biotags (SBTs), which can now be routinely synthesized.18 All SBTs can be excited using a single, very-low-intensity laser source. SERS tags are especially applicable to biomedical applications, since they are excited by tissue-penetrating lasers in the red to near-infrared range, resulting in low autofluorescence and high signal enhancement.19,20 Microfluidic devices integrating SERS platforms reported in the literature have studied reaction optimization in a continuous flow format,21 electrophoretic separation of analytes,22 and multiplexed detection of oligonucleotides.23 Others have recently analyzed cells in microfluidic devices using nanoparticle-free Raman and optical trapping.24,25 The central feature of SERS is its multiplexing capability by using premade, encapsulated nanoparticle clusters that are then infused with one of several highly Raman-active reporter molecules (see Fig. 1). The multiple narrow bands in the SERS spectrum act as unique barcodes that are spectrally differentiable from other tags,18,20 allowing direct determination of the relative contribution of individual SBTs to the overall spectrum. The SERS intensities achieved are comparable to those of fluorescence.26 Fig. 1Surface-enhanced Raman spectroscopy (SERS) biotag (SBT) signals originate from closely spaced nanoparticles. (a) SBT design includes the dimer junction, a stabilizing coat with attached affinity agent, and the Raman active spectral tag. (b) Transmission electron microscopy (TEM) of a silver dimer with coating visible. Plasmon resonance coupling between nanoparticle dimers form high field gradients, enhancing the Raman scattering from reporter molecules contained within the structure. (c) Spectral signatures from the two encoded SBTs: thionin and methylene blue (MB). Spectra are shifted for clarity. 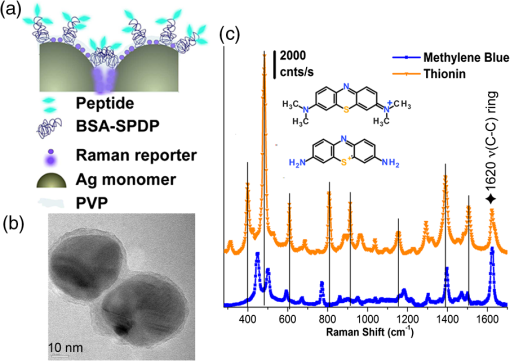 As a demonstration of the technology’s far-reaching capabilities, we recently used these spectrally rich barcodes to detect the unique neuropilin-1 (NRP) biomarker expression pattern of prostate cancer cells, contrasting them to healthy prostate cells.20 Two sets of SBTs were used in combination to discriminate the cell types. One SBT targeted the NRP receptors of cancer cells, whereas the other functioned as a positive control (PC) by binding to both noncancerous and cancer cells (via the HIV-derived TAT peptide). Methylene blue (MB) and thionin [Fig. 1(c)] were used as Raman reporters on the PC-SBT and the NRP-SBT, respectively. Point-by-point two-dimensional (2-D) Raman maps and average SERS signal per cell yielded a characteristic NRP/PC ratio from which cancer cells were identified.20 Here, we describe our progress toward the development of a powerful technique for identifying and sorting individual mammalian cells, such as individual cancer cells, by combining Raman spectroscopy (and the previously described20 ratiometric analysis) with flow-focusing microfluidics. By labeling mammalian cells with SBTs and flowing them in a flow-focused microfluidic channel, the cells can be individually and rapidly interrogated by laser Raman, with identification possible by spectral unmixing of the SERS signals. The enhancement that SERS provides allows the biotags’ entire Raman spectrum to be recorded and, when multiple tags are used, ratiometric methods to be employed, as one or more of the on-board tags can act as a local intensity reference. A hydrodynamic flow-focusing microfluidic system was designed to enable mammalian cell interrogation and identification at the single-cell level using SBTs. Herein we report our progress in transferring to the microfluidic environment this ratiometric method that we have previously used with two sets of SBTs to unequivocally distinguish between cancer and normal cells by the ratio of the two SBTs20 (Fig. 2). We have successfully built a microfluidic device in which we used streptavidin-coated (STV), -diameter polystyrene beads as cell mimics to evaluate the devices and the SERS response. We show below that we are able to successfully detect flowing polystyrene beads loaded with biotin-functionalized SBTs (b-SBTs) via SERS spectral deconvolution and detect two distinct populations based on our ratiometric approach. We also present our preliminary results flowing live mammalian cancer cells labeled with SBTs. Fig. 2(a) Illustration of the flow-focusing device that we propose for cell identification using two SBTs. Green SBTs bind to all cells, whereas red ones bind only to the target cancer cell (brown). As each cell passes through the laser, the ratio of tags is determined. (b) Time-lapse composite image of some beads flowing in the device. Each bead is colorized so that its path along the channel can be recognized in the picture. The image is overlaid with the picture of the device under the Raman microscope. The red laser line is visible to the right of the junction. The buffer flowing in the cell/bead inlet channel is colored so that the actual shape of the flow is also visible as a darker area that narrows after the junction, where the two sheath flows meet with the cell/bead flow. 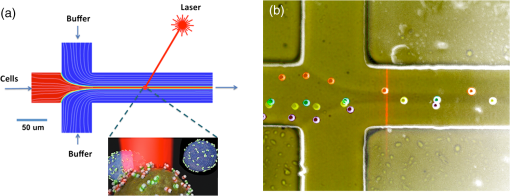 2.Methodology2.1.SBT SynthesisThe procedure for SBT synthesis has been described in detail previously.20 The silver colloid was synthesized according to the Lee and Meisel protocol:27 500 mL deionized MilliQ water (DI) (resistivity ) with 1 mM silver nitrate (Sigma) (99.999%) were brought to a boil, and 10 mL of 1% trisodium citrate dihydrate (Fisher) was added. The mixture was kept at boiling temperature for about 90 min until the color turned dark green/gray. Aliquots of the colloid were taken and centrifuged at to remove the smallest particles. The yellow supernatant was discarded, and the pellet was resuspended in DI and diluted until the absorbance of the band at 406 nm was 0.3 at 0.1 mm path length. The resulting colloid is called . SBTs were then prepared by adding 3.5 μL phosphate buffer (250 mM, pH 7.5) and 4 μL hexamethylenediamine (Sigma, 98%, in DI, pH 4.0) to every 100 μL , waiting for 2 min, then adding 4 μL of 1% polyvinylpyrrolidone 40 kDa (Sigma) in DI and 100 μL DI, waiting for 5 min, and finally adding 2 μL BSA-SPDP [ in PBS, bovine serum albumin (Sigma), modified with -succinimidyl 3-(2-pyridyldithio)-propionate (SPDP) (Pierce #21857)] so that the modified protein interacts with the Ag surface strongly through the SPDP molecule, with the pyridine group appearing in the SERS spectrum before the Raman reporter is added. Each protein carries several free-hanging SPDP groups that can interact with the Cys-peptides, thus holding peptides on the outside of the SBT coating for possible interaction with cell membranes. The particles resulting from this controlled aggregation stage are called and were used to prepare either NRP- and PC-SBTs for use in cells or b-SBTs for use with beads. For PC-SBT, 4 μL MB (Sigma, dye content , 600 μM in DI) and 2 μL KCl (Mallinkrodt Baker Phillipsburg, 500 mM) were added to every 200 μL and incubated at room temperature for 30 min. We added 2 μL FAM-Cys-TAT (500 μM in DI), incubated for 15 min, and backfilled with 1 μL BSA 5% ( PBS). For the NRP-SBT, we added 4 μL thionin (Sigma, dye content , in DI) to every 200 μL , incubated for 30 min at room temperature, added 2 μL BSA-SPDP ( in PBS), waited for 15 min, and added 1 μL BSA 5% (in PBS) and 5 μL FAM-CGRPARPAR-OH (provided by Erkki Ruoslahti’s group at Sanford-Burnham Medical Research Institute, 200 μM in DI). For b-SBTs, the peptide step was replaced by the addition of succinimidyl valerate--biotin (LysanBio) at a final concentration of colloid and incubation at 4°C overnight. After adding 0.005% final concentration of Tween-20 (T20) [polyoxyethylene (20) sorbitan monolaurate solution 10% in , Sigma], the SBTs were washed by centrifugation (10 min at ), the supernatant was discarded (to remove most of the non-SERS bright single silver nanoparticle biotags), and the pellet was resuspended in either th (for beads) or th (for cells) the initial volume in T20. 2.2.Device ManufacturingThe microfluidic device [see Fig. 2(a) for layout design] was fabricated using polydimethylsiloxane (PDMS) sandwiched between two glass slides. Inlets and outlets were drilled into the glass. Pipet tips were glued to the glass as reservoirs and as vacuum line interface at the inlets and outlet, respectively. The flow was driven by a diaphragm vacuum pump (Gast Manufacturing Corp.) connected to the outlet of the device. To pattern the channels on the PDMS layer, a mold was fabricated first out of SU-8 photoresist on a silicon wafer using soft photolithography. PDMS was then mixed with cross-linker and poured on the mold. After an hour of heating at 80°C, the PDMS was peeled off the mold with channels facing the mold. Via holes were punched in the outlet and inlets and the PDMS layer was bonded to glass slides after ozone treatment of the bonding side. Devices with varying channel dimensions were used to accommodate either cells or beads. Device 1, used for beads, had a depth of 20 μm and a width of the interrogation region (postjunction) of 50 μm. Device 2, used with cells, had a depth of 40 μm and the same interrogation region width as device 1. The ratio of the middle channel over the side channel flow rates was 0.66 for device 1 and 0.25 for device 2. The above combination of parameters allowed us to have focal widths of 20 μm for device 1 and 10 μm for device 2. 2.3.Bead PreparationSTV polystyrene beads of in diameter (Polysciences 24158-1) were washed twice by centrifugation according to manufacturer’s protocol to remove excess streptavidin. The pellet was resuspended in PBS with 1% BSA (Sigma) and 0.005% T20 and stored at 4°C. For incubation with SBTs, the beads stock was used at th, and 1 μL b-SBTs at the required ratio were added to every 100 μL beads and incubated for at room temperature. Beads were then either placed on a microscope slide for 2-D SERS mapping or injected into the devices. This concentration of beads resulted in a nominal throughput of after the junction in the device. The velocity of the beads at the interrogation spot was , which means that each bead was effectively exposed to the laser for 1 to 2 ms. 2.4.Cell CulturePPC-1 cells, an epithelial cell line originating from bone metastasis of a prostate cancer patient, expressing the biomarker NRP-1 were generously supplied by Erkki Rouslahti’s group (Sanford-Burnham Medical Research Institute, UC Santa Barbara). They were grown in Dulbecco modified Eagle medium (DMEM)/high glucose (HyClone) supplemented with 10% FBS, at 37°C in a 5% atmosphere. Cells were plated in multiwell plates and harvested after using a nonenzymatic cell dissociation buffer (Invitrogen) that does not disrupt the membrane receptors. Cells were then washed by centrifugation for 2 min at , and the pellet was resuspended in the appropriate volume of FBS to obtain a concentration of . SBTs were then added to each cell suspension (with PC versus NRP ratio of ) and incubated for 60 min at room temperature mixing every 15 min, then injected into the device’s inlet. 2.5.SERS MeasurementsSERS measurements were conducted using a Horiba Jobin-Yvon LabRAM Aramis spectrometer, equipped with 633 nm excitation. The static measurements on beads deposited on glass were carried out by scanning each bead with the objective (5 μW at sample), using a hole of 600 μm, slit of 300 μm, and grating. Each point in the 2-D map was collected at 1.8 μm step size. SERS time measurements were carried out using a long-working-distance objective (8 mW spread across the line) in line scan mode. In this modality, the laser is rastered at high speed over a region of the sample by an oscillating mirror, forming an excitation line, with the laser “curtain” axis perpendicular to the flow [see Fig. 2(b)]. This modality was chosen to compensate for slight cell misalignment in the flow, which could have resulted in missed events by the small laser spot size (, less than the typical size of a cell) when used in the standard point scan acquisition mode. The slit was set to 250 μm, the hole 600 μm, and grating. For beads, the data were acquired with a point every 150 to 200 ms, with laser exposure times of 20 ms and a point every 550 ms, with laser exposure time of 400 ms for cells. A solution of SERS-tagged cells/beads was put in the middle channel inlet, and the side channels were filled with buffer. 2.6.Data AnalysisThe detailed data analysis was described previously.20 Briefly, initial analysis (mapping, whole-cell averaging of signal, baseline correction, normalization) was performed with the on-board program LabSpec. The deconvolution and NRP/PC ratio calculations were done using Mathematica’s FindFit, a nonlinear least-squares fitting algorithm, and the SBT pure spectra were processed by a customized Mathematica program. For microfluidics time series, the sequential spectra are thresholded to restrict analysis to high-intensity events. The threshold is chosen based on the median of the intensity () of the band at in the raw data for the entire time series plus 5 standard deviations (SDs) for beads or 3 SDs for cells. The unmixing by linear combination of basis spectra give ratios of the two tags (thionin and methylene blue SBTs). 3.Results and DiscussionTo combine the ratiometric analysis with the microfluidic platform, a sample of target cells (or beads), previously incubated with SBTs, was injected into the microfluidic device. The cells/beads are hydrodynamically focused to the center of the channel, so that they can be interrogated, single file, by the laser [Fig. 2(b)]. The device developed for this purpose has three inlet flows that meet at a junction where the middle fluid, containing cells/particles, is sandwiched by two sheath flows of buffer. The channel lengths and flows are designed such that cells/particles advect in a single file after the junction and with a velocity that dictates residence time in the laser. The exposure time for each cell can be calculated knowing cell size and flow velocity. The whole system is run with a single vacuum pump at the outlet.28 We obtained initial results using STV beads conjugated with SBTs. We validated the detection and spectral unmixing first by placing on a glass slide beads on which b-SBTs were adsorbed at different ratios to replicate the scenario of differential binding and uptake rate by various cells. Figure 3 summarizes how beads carrying SBTs were analyzed on glass. The chosen bead is scanned with the laser across the area enclosed by the square, then the average spectrum from the whole bead is fitted using a least-squares algorithm to determine the relative fraction of each tag [Fig. 3(f)]. Figure 3(f) shows the measured ratio from several beads incubated with either or ratio of the two b-SBTs. When the NRP/PC ratio was , the actual measured value was 1.4. Knowing this, we converted a second volume ratio of to an expected intensity ratio of 0.8. The observed value of 0.7 indicates that the spectra were accurately unmixed. Fig. 3Panels (a)–(d) summarize the data collection and analysis done on each streptavidin-coated (STV) beads carrying biotin-functionalized SBTs (b-SBTs). First, each bead is scanned by the laser (a) to obtain a 2-D map that shows the variation of intensity of a certain band of interest ( in our case) across the and directions (b). The average signal across each bead is then fitted using a direct least-squares algorithm (c), whose individual components can be seen in panel (d). From the fit coefficients and an appropriate calibration curve, we then estimate the percent composition of each tag. (e), TEM image of an STV bead carrying several b-SBTs. (f) Robustness of our calibration method. A sample prepared using a tag ratio of produces a measured value of . Using this correction, a sample should yield an observed value of 0.7, close to the observed value of . 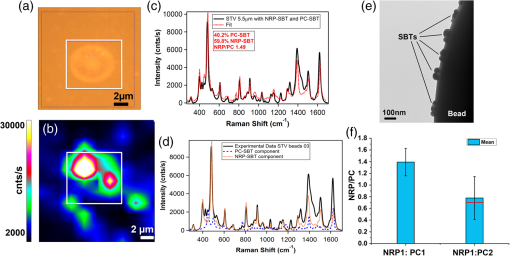 When beads incubated with b-SBTs at an NRP/PC ratio of are flowed into the device, we are able to detect their passage based on the Raman signature of the SBTs. After applying the threshold according to the procedure in Sec. 2.6, 54 bead events were counted [Fig. 4(b)]. Based on the total acquisition time, estimated flow rate, and bead concentration (see Sec. 2.4), we expected to count a maximum of 75 beads. The discrepancy is likely due to the times when the detector is inactive or possible device-to-device variations in actual flow rate. The average NRP/PC ratio [Fig. 4(b)] for the 54 events was . The high SD is due to the presence of eight events that exhibited a ratio considerably higher than 2.5 and could be caused either by beads with an unusually high number of bound NRP b-SBTs or random free-flowing unusually bright SBTs or their aggregates. When the outliers are excluded, the mean NRP/PC ratio was , in accordance with the average value of obtained from the static maps on glass [Fig. 3(f)]. Fig. 4Thresholding and resulting neuropilin-1 (NRP)/positive control (PC) ratios for beads carrying b-SBTs in device 1. (a) Values of the fit coefficients for both tags (NRP, solid; PC, dotted) at each time point before applying the threshold. (b) Bead events after applying the threshold to the raw data (). The square dots represent the NRP/PC ratio for each bead event above threshold. 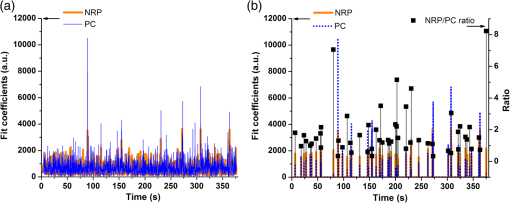 To test the device with living cancer cells, we incubated PPC-1 cells with NRP and PC-SBTs (device 2). Although the cells ceased flowing after a few minutes (possibly due to clogging of the inlet or outlet channels, thus limiting the vacuum efficiency), we were able to identify cell events using the threshold methodology employed for beads [Fig. 5(a) and 5(b)]. We confidently detected 45 cell events, yielding a mean NRP/PC ratio of , consistent with our previously reported20,29 value of . We observed the presence of one event with an abnormally high ratio of 3.9, once again possibly due to either a cell binding mostly NRP-SBTs or the presence of particularly bright free-flowing NRP-SBTs. Figure 5(b) shows some examples of the fits obtained with the Mathematica algorithm for cell events both above and below threshold. We are currently optimizing the device to collect more events to analyze statistical populations of cancer cells and mixtures of normal and cancer cells. Fig. 5Thresholding and resulting NRP/PC ratios for cells carrying NRP and PC-SBTs in device 2. (a) Cell events after applying the threshold to the raw data (). The square dots represent the NRP/PC ratio for each cell event above threshold. (b) Fits (red trace) of events above and below threshold for device 2 when cells are flown in it, overlaid with the experimental spectrum (blue trace).  4.ConclusionsWe successfully built a flow-focusing microfluidic device for the ratiometric SERS analysis of beads and cells, tagged with two sets of SBTs. The beads/cells travel along a single file focused in the center of the device. When the SBTs cross the laser line, a full Raman spectrum is acquired. The signal is a composite of the two SBTs and can be deconvoluted to ultimately determine the relative amount of each component. We show that we can detect beads/cells by SERS that travel across the laser at times in the order of a few milliseconds. The indicative ratio is independent of variations in the location of the focal plane, the local cell concentration, and turbidity. The technique also benefits from the low laser intensities (8 mW total, spread across the line) needed for good signal-to-noise ratio and the use of a single wavelength to excite all SBTs. AcknowledgmentsThis work was supported by the Institute for Collaborative Biotechnologies through grant W911NF-09-0001 from the U.S. Army Research Office. The content of the information does not necessarily reflect the position or the policy of the government, and no official endorsement should be inferred. This work made extensive use of the MRL Central Facilities at UCSB supported by the National Science Foundation under award nos. DMR-0080034 and DMR-0216466 for HRTEM/STEM microscopy. G.B.B. acknowledges fellowship support from the Cancer Center of Santa Barbara. We thank Prof. Norbert Reich for access to cell culture facilities, Dr. Alexander Mikhailovsky for assistance with the Raman system, and Prof. Erkki Ruoslahti for providing the FAM-CGRPARPAR-OH peptide. Authors’ contribution: all authors designed research; A.P. and M.R.H. performed experiments; A.P., M.R.H., and G.B.B. analyzed data; A.P., M.M. and C.M. wrote the paper and supervised the research. ReferencesM. Rouprêtet al.,
“Molecular detection of localized prostate cancer using quantitative methylation-specific PCR on urinary cells obtained following prostate massage,”
Clin. Cancer Res., 13
(6), 1720
–1725
(2007). http://dx.doi.org/10.1158/1078-0432.CCR-06-2467 CCREF4 1078-0432 Google Scholar
H. I. Scheret al.,
“Circulating tumour cells as prognostic markers in progressive, castration-resistant prostate cancer: a reanalysis of IMMC38 trial data,”
Lancet Oncol., 10
(3), 233
–239
(2009). http://dx.doi.org/10.1016/S1470-2045(08)70340-1 LOANBN 1470-2045 Google Scholar
M. Yuet al.,
“Circulating tumor cells: approaches to isolation and characterization,”
J. Cell Biol., 192
(3), 373
–382
(2011). http://dx.doi.org/10.1083/jcb.201010021 JCLBA3 0021-9525 Google Scholar
M. Hendrixet al.,
“Molecular biology of breast metastasis: molecular expression of vascular markers by aggressive breast cancer cells,”
Breast Cancer Res., 2
(6), 1
–6
(2000). http://dx.doi.org/10.1186/bcr88 BCTRD6 0167-6806 Google Scholar
P. Paterlini-BrechotN. L. Benali,
“Circulating tumor cells (CTC) detection: clinical impact and future directions,”
Cancer Lett., 253
(2), 180
–204
(2007). http://dx.doi.org/10.1016/j.canlet.2006.12.014 CALEDQ 0304-3835 Google Scholar
D. C. Danilaet al.,
“Circulating tumor cell number and prognosis in progressive castration-resistant prostate cancer,”
Clin. Cancer Res., 13
(23), 7053
–7058
(2007). http://dx.doi.org/10.1158/1078-0432.CCR-07-1506 CCREF4 1078-0432 Google Scholar
S. MaheswaranD. A. Haber,
“Circulating tumor cells: a window into cancer biology and metastasis,”
Curr. Opin. Genet. Dev., 20
(1), 96
–99
(2010). http://dx.doi.org/10.1016/j.gde.2009.12.002 COGDET 0959-437X Google Scholar
X. Huet al.,
“Marker-specific sorting of rare cells using dielectrophoresis,”
Proc. Natl. Acad. Sci. U. S. A., 102
(44), 15757
–15761
(2005). http://dx.doi.org/10.1073/pnas.0507719102 1091-6490 Google Scholar
M. Bergeret al.,
“Design of a microfabricated magnetic cell separator,”
Electrophoresis, 22
(18), 3883
–3892
(2001). http://dx.doi.org/10.1002/(ISSN)1522-2683 ELCTDN 0173-0835 Google Scholar
D. W. Ingliset al.,
“Microfluidic high gradient magnetic cell separation,”
J. Appl. Phys., 99
(8), 08K101
(2006). http://dx.doi.org/10.1063/1.2165782 JAPIAU 0021-8979 Google Scholar
N. PammeC. Wilhelm,
“Continuous sorting of magnetic cells via on-chip free-flow magnetophoresis,”
Lab Chip, 6
(8), 974
–980
(2006). http://dx.doi.org/10.1039/b604542a LCAHAM 1473-0197 Google Scholar
A. T. Harriset al.,
“Raman spectroscopy and advanced mathematical modelling in the discrimination of human thyroid cell lines,”
Head Neck Oncol., 1 38
(2009). http://dx.doi.org/10.1186/1758-3284-1-38 HNOEAE 1758-3284 Google Scholar
P. Crowet al.,
“The use of Raman spectroscopy to differentiate between different prostatic adenocarcinoma cell lines,”
Br. J. Cancer, 92
(12), 2166
–2170
(2005). http://dx.doi.org/10.1038/sj.bjc.6602638 BJCAAI 0007-0920 Google Scholar
L. Sunet al.,
“Composite organic−inorganic nanoparticles as Raman labels for tissue analysis,”
Nano Lett., 7
(2), 351
–356
(2007). http://dx.doi.org/10.1021/nl062453t NALEFD 1530-6984 Google Scholar
B. Lutzet al.,
“Raman nanoparticle probes for antibody-based protein detection in tissues,”
J. Histochem. Cytochem., 56
(4), 371
–379
(2008). http://dx.doi.org/10.1369/jhc.7A7313.2007 JHCYAS 0022-1554 Google Scholar
J. M. Yuenet al.,
“Transcutaneous glucose sensing by surface-enhanced spatially offset Raman spectroscopy in a rat model,”
Anal. Chem., 82
(20), 8382
–8385
(2010). http://dx.doi.org/10.1021/ac101951j ANCHAM 0003-2700 Google Scholar
S. Fenget al.,
“Nasopharyngeal cancer detection based on blood plasma surface-enhanced Raman spectroscopy and multivariate analysis,”
Biosens. Bioelectron., 25
(11), 2414
–2419
(2010). http://dx.doi.org/10.1016/j.bios.2010.03.033 BBIOE4 0956-5663 Google Scholar
G. B. Braunet al.,
“Generalized approach to SERS-active nanomaterials via controlled nanoparticle linking, polymer encapsulation, and small-molecule infusion,”
J. Phys. Chem. C, 113
(31), 13622
–13629
(2009). http://dx.doi.org/10.1021/jp903399p 1932-7447 Google Scholar
A. Pallaoroet al.,
“Mapping local pH in live cells using encapsulated fluorescent SERS nanotags,”
Small, 6
(5), 618
–622
(2010). http://dx.doi.org/10.1002/smll.v6:5 1613-6829 Google Scholar
A. PallaoroG. B. BraunM. Moskovits,
“Quantitative ratiometric discrimination between noncancerous and cancerous prostate cells based on neuropilin-1 overexpression,”
Proc. Natl. Acad. Sci. U. S. A., 108
(40), 16559
–16564
(2011). http://dx.doi.org/10.1073/pnas.1109490108 1091-6490 Google Scholar
S.-A. Leunget al.,
“A method for rapid reaction optimisation in continuous-flow microfluidic reactors using online Raman spectroscopic detection,”
Analyst, 130
(1), 46
–51
(2005). http://dx.doi.org/10.1039/b412069h ANLYAG 0365-4885 Google Scholar
R. M. ConnatserL. A. RiddleM. J. Sepaniak,
“Metal-polymer nanocomposites for integrated microfluidic separations and surface enhanced Raman spectroscopic detection,”
J. Sep. Sci., 27 1545
–1550
(2004). http://dx.doi.org/10.1002/(ISSN)1615-9314 JSSCCJ 1615-9306 Google Scholar
F. T. Dochertyet al.,
“The first SERRS multiplexing from labelled oligonucleotides in a microfluidics lab-on-a-chip,”
Chem. Commun. (Camb.),
(1), 118
–119
(2004). http://dx.doi.org/10.1039/b311589e CHCOFS 1364-548X Google Scholar
S. Dochowet al.,
“Tumour cell identification by means of Raman spectroscopy in combination with optical traps and microfluidic environments,”
Lab Chip, 11
(8), 1484
–1490
(2011). http://dx.doi.org/10.1039/c0lc00612b LCAHAM 1473-0197 Google Scholar
A. Y. LauL. P. LeeJ. W. Chan,
“An integrated optofluidic platform for Raman-activated cell sorting,”
Lab Chip, 8
(7), 1116
–1120
(2008). http://dx.doi.org/10.1039/b803598a LCAHAM 1473-0197 Google Scholar
G. Sabattéet al.,
“Comparison of surface-enhanced resonance Raman scattering and fluorescence for detection of a labeled antibody,”
Anal. Chem., 80
(7), 2351
–2356
(2008). http://dx.doi.org/10.1021/ac071343j ANCHAM 0003-2700 Google Scholar
P. C. LeeD. Meisel,
“Adsorption and surface-enhanced Raman of dyes on silver and gold sols,”
J. Phys. Chem., 86
(17), 3391
–3395
(1982). http://dx.doi.org/10.1021/j100214a025 JPCHAX 0022-3654 Google Scholar
T. Stileset al.,
“Hydrodynamic focusing for vacuum-pumped microfluidics,”
Microfluid. Nanofluid., 1
(3), 280
–283
(2005). http://dx.doi.org/10.1007/s10404-005-0033-z 1613-4982 Google Scholar
A. PallaoroG. BraunM. Moskovits,
“SERS biotags (SBTs) for the quantitative ratiometric discrimination between noncancerous and cancerous prostate cells,”
MRS Proc., 1468
(2012). http://dx.doi.org/10.1557/opl.2012.1495 Google Scholar
Biography Alessia Pallaoro has been a postdoc researcher in Prof. Martin Moskovits’s laboratory at UCSB since 2009. She received her PhD in materials engineering from the University of Trento, from which she also received her MS in physics and biomedical technologies and her BS in applied physics. Her research is aimed at the development of silver nanoparticle platforms for cancer detection by SERS, and gold nanoshells for the delivery of drugs and nucleic acids via laser release (the latter in collaboration with Prof. Norbert Reich).  Mehran R. Hoonejani received his BSc in mechanical engineering from the University of Tehran in 2007, where he also received his MSc in mechanical engineering in 2009 with emphasis on fluid mechanics and heat transfer optimization. He is currently a PhD student in the mechanical engineering program at the University of California–Santa Barbara under supervision of Prof. Carl Meinhart working on Raman spectroscopy for cellular discovery.  Gary B. Braun received his BS and PhD in chemistry at UCSB, studying surface-enhanced Raman spectroscopy with nanoparticle systems. He joined the Sanford Burnham Medical Research Institute as a postdoctoral associate in Erkki Ruoslahti’s laboratory and is currently studying the use of nanoparticles for various biological applications, including cancer detection, cell transport pathways, and drug screening.  Carl Meinhart is a professor of mechanical engineering at the University of California–Santa Barbara. He completed his PhD and postdoctoral work at the University of Illinois in June 1995. At the University of Illinois, his research involved the investigation of turbulent flows. Since coming to UCSB in 1996, his research has focused on developing microfluidic devices and exploring their fundamental transport mechanisms.  Martin Moskovits is professor of physical chemistry at the University of California. From 2007 to 2010, he served as chief technology officer of API Technologies Corp. and president of its NanoOpto subsidiary. He is a founder of Spectra Fluidics, a startup company dedicated to developing sensors based on microfluidics. From 1972 to 2000, he was professor of chemical physics at the University of Toronto and chair of the Department of Chemistry (1993 to 1999). He was the founding director of the program in nanoelectronics for the Canadian Institute for Advanced Research (1999 to 2003). |

