|
|
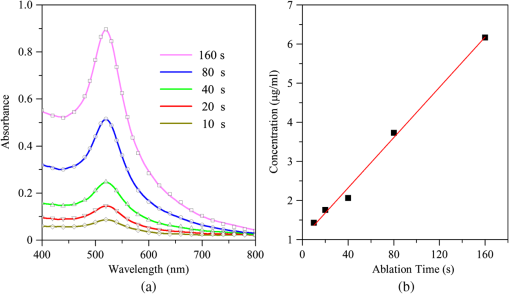
1.IntroductionNanoparticles (NPs) of noble metal, especially gold (Au) NPs, represent an important class, largely investigated to date because of their visible plasmon frequencies and minimal reactivity. Pulse laser ablation in liquid (PLAL) has recently become one of fascinating top-down approaches for its simplicity in generating fine micro/nanoparticles with an outstanding purity and highly stable colloids.1–3 Many studies have been carried out to improve the structure and morphology of gold colloids by engaging several processing elements,4 including laser parameters, liquid species, physical conditions, and chamber design. When it comes to characterizing the AuNPs, sophisticated and expensive microscopic techniques such as transmission electron microscopy (TEM), atomic force microscopy, and scanning electron microscopy are often used. Even though it is possible to obtain the average size and mass distribution of the particles, information in terms of concentration and aggregation of NPs is still lacking and needs further attention. One way to overcome the drawback is by introducing a more economical, easier and faster measurement of NP through a real-time monitoring system. The aim of this paper is to introduce an in situ analysis by monitoring and controlling the formation of AuNPs production via a PLAL system. The synthesis of AuNPs is optimized via several working conditions within the ablation system. Since the surface plasmon absorption (SPA) of AuNPs is strongly dependent on the average size and concentration, UV-Vis spectroscopy enables one to characterize the content of Au suspension by fitting the spectra according to the Mie–Gans model. 2.Experimental Section2.1.Pulse Laser Ablation in Liquid(a) A Q-switched Nd: YAG laser (pulse width, 10 ns; repetition rate, 10 Hz, operating in the fundamental wavelength of 1064 nm) was focused on a pure Au metal plate (99.99%) through a lens of 100 mm focal length. It was placed at the bottom of a quartz cell manufactured by Hellma® with dimensions of filled by 10 ml of deionized water. The depth of the water layer above the target was fixed at 10 mm. The reference position between the lens and surface target was fixed at 37 mm due to the refraction of light phenomenon.5 During the ablation process, the cuvette was rotated slowly in order to avoid craters on the surface of the target. The cuvette was placed on a rotational platform (Newport®-UTR80) that revolved at a constant speed of 5 rounds per minute (RPM) driven by a stepping motor. Increasing the current through the motor allows increasing the speed of the rotation. 2.2.In Situ UV-Vis Spectroscopy(a) An in situ measurement of nanoparticle is based on UV-Vis spectroscopy. In order to provide a homogenous solution, the measurement was taken at each rotational stop. The optical absorption setup comprises a versatile broadband deuterium-halogen light source, [AvaLight-D (H)-S, Avantes] optimized for the UV-Vis-NIR (215–2500 nm). The light source was coupled to an optical fiber (P400-1-SR, Ocean Optics) through a collimator lens (74-UV, Ocean Optics). The light was connected to a broad-band probe light, via an USB2000 + detector (miniature fiber-optic spectrometer, Ocean Optics). The intensity of the spectrum was measured precisely with the aid of Spectrasuite software (Ocean Optics). 2.3.Size, Shape, and Concentration of AuNPsInformation regarding the formation of Au suspension alternatively can be attained from the interpretation of the UV-Vis spectrum in terms of the Mie–Gans theory.6 For particle radius, is much smaller compared to the wavelength of the exciting light,7 and higher-order terms of the multipolar expansion can be ignored; no scattering is expected from the bulk. Thus, the absorption cross sections within the dipolar approximation for a single spherical particle with Mie model can be expressed as7 where is the absorbed wavelength, is the average volume per particle of radius , is the dielectric constant of the host medium and is the complex dielectric function of AuNPs. Aggregated particles usually take the form of cigar-like shaped particles; hence, the rest of the non-spherical arbitrary shape particles are treated as spheroidal particles with the length of the three axes to be , , and , where is the smaller axis and .8 In modeling the prolate spheroids of the aspect ratio, the dipolar extinction cross section is given by8 where is the shape factors that relate to the aspect ratio of the particles and is the volume. The fraction of spheroidal particles, can be described by the distribution of aspect, that is assumed to be in Gaussian form:7 where is the standard deviation for the distribution of aspect ratios. The total number of particles per volume, can be determined from the Beer–Lambert law equation which is expressed as where is the absorbance of the surface plasmon peak, and is the optical path length inside the cuvette. These three important parameters (, , ) are adequate to define the absorption spectra profile prior to estimating the particle dimensions along with the aggregation contributions.9 As for the local dielectric function of gold, the reported data in Ref. 10 was used for the corrected free mean path of small AuNPs.Morphology and size distribution of AuNPs were observed by an energy filtered transmission electron microscopy (EFTEM) model Libra 120-Carl Zeiss, at an accelerating voltage of 120 kV. The size distribution of AuNPs was obtained by measuring diameters of more than 350 NPs in sight using “ImageJ Tool” software. 3.Results and DiscussionFigure 1(a) shows the assembly of in situ measured and calculated UV-Vis spectra of AuNPs produced by laser ablation in deionized water. The measurement of each spectrum was characterized as tabulated in Table 1. An average radius of the AuNPs was expanded and the SPA maximum slightly blue-shifted as the ablation time increased. In literature,11 below a size of 25 nm for Au, is much more pronounced on the bandwidth and less dependent upon the maximum peak, of the local-field enhancement. Fig. 1(a) Time evolution of in situ UV-Vis measured spectra of AuNPs synthesized by PLAL method at different time interval (colored lines) fitted to the Mie–Gan model (symbols). (b) Calibration curve of absorbance at 380 nm with respect to gold mass concentration. Fitting parameters are reported in Table 1.  Table 1Optical properties of AuNPs at different ablation times.
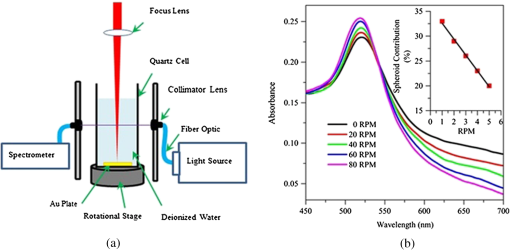
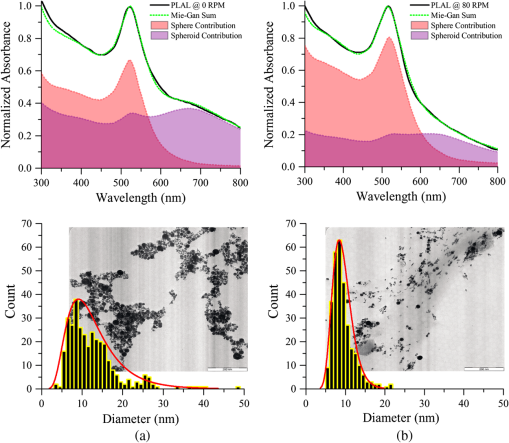
A longer time ablation translates to higher numbers of pulses which leads to a greater number of particles that coexist inside a medium which is likely to induce plasmonic coupling between the particles. Although the aggregation is minimized based on the low spheroid contributions, large colloids are often interlinked by smaller particles to form a bigger particle radius for the particles in the solution. The particle density, measured in molarity, (), behaves in a linear fashion as the ablation time increases as shown in the inset of Fig. 1(b). On average, the Au mass ablation rate is found to be . Continuous rotation of the surface target during laser ablation, as depicted in Fig. 2, distributes the large colloidal particle formed in the solution and prevents the agglomeration process due to further interaction with the laser beam. The generated Au particles are collected in the middle of the solution and can readily undergo laser irradiation synthesis before dispersing throughout the medium once the rotational stage stops. The fitting parameters are reported in Table 2. The SPA maximums were seen to be sharply located around 520 nm and slightly enhanced toward the shorter spectral region. The ratio of the absorbance at different wavelengths () can be used to quantitatively monitor the aggregation principal without knowledge of the particle size and concentration.12 The absorption spectra beyond 600 nm are exclusively attributed to the existence of a small amount of oblate particles. Higher values of the ratios possess a lower agglomeration definition between the generated particles. As the rotational speed increases, larger particles are fragmented into smaller ones by the Coulomb explosion that leads to an average radius below 5 nm in size. On the other hand, the lower value of reflects the small fraction of the spheroidal contributions. The finding suggests that the aggregation and reshaping of the AuNPs are considered to be induced by photoexcitation followed by the melting of the NPs based on the laser-liquid interaction.13 A linear relationship between the contributions of the spheroidal particles and the rotational speed was obtained as shown in the inset of Fig. 2. These indicate the lower contribution of the spheroidal particles and a much greater contribution from smaller sphere particles oscillating near the surface plasmon resonance of the local electromagnetic field. Figure 3 shows a clearer view of the absorption spectrum of AuNPs stationary both stationary (0 RPM) and rotating at 80 RPM with respect to Fig. 2(b), together with the EFTEM image. The filled area under the graph illustrates the contribution of spherical and spheroidal particles in the solution, respectively. For 0 RPM, shown in Fig. 3(a), the Mie–Gans fitting built on the summation of both shape contributions demonstrates an average radius of in accordance with the spheroid’s contributions of 34%. When observing the corresponding electron micrograph, the AuNPs were seen overlapping among each other and showed the presence of cigar-like particle shapes made by several closely bound aggregated particles. As specified by the TEM analysis, the mean radius and standard deviation calculated from the log-normal distribution are . This is in good agreement with the Mie–Gans calculation. The optimal maximum speed was determined at 80 RPM. Mie–Gans calculation traces with a smaller average radius of for the fraction of spheroidal particles significantly diminished to 20% after the laser treatment, as shown in Fig. 3(b). This led to the low absorbance above the 600 nm spectral range. Furthermore, the size distribution of AuNPs tends to shift to smaller radii after the rotation speed increases. The formation of the particles observed was well separated with respect to one another and revealed a more nearly spherical shape where the average radius and size distribution were calculated to be . This still provides remarkable agreement with the radius calculated with the Mie–Gans model. The results showed that at 0 RPM, the NPs were found to aggregate, whereas at the higher rotational speed of 80 RPM, they were found to be reduced in size and exhibited a narrower size distribution as well as a larger number of smaller NP particles within the solution. The better size separation offers a lower degree of polydispersity (15.5%) for a one-step AuNPs synthesis. Fig. 2(a) Schematic diagram of AuNPs generated based on pulse laser ablation on a rotating surface plate immersed in deionized water. (b) UV-Vis measured spectra of AuNPs at different rotational speed fixed at a constant time. Inset: Fraction of spheroidal contribution between rotational speeds.  Table 2Optical properties of AuNPs at different rotational speeds.
Fig. 3(Top) Absorption spectrum of AuNPs synthesized by PLAL process at two separate rotational speeds (black line) for (a) 0 RPM and (b) 80 RPM. Mie–Gans curve fitting (green dots), spherical contribution (red region) and spheroids contribution (purple region) to the fitting. (Bottom) The AuNPs size distribution fitted with a log-normal curve (red line) from EFTEM image.  4.ConclusionsA simple, cost-effective, and fast calculation of fresh AuNPs formation was successfully obtained based on the in situ measurement of the SPA spectra. The characterization method can be a key tool for monitoring and efficiently controlling the agglomeration of AuNPs. Moreover, this feature allows the determination of an optimal process control and the quality of the mass production by PLAL. Information in terms of the average size, shape, and density was identified through fitting the measured absorption spectra using the Mie–Gans approach which compared well with TEM analysis. AcknowledgmentsWe would like to express our thanks to the Malaysian Ministry of Education through the FRGS fund with vote 4F543, and UTM through RMC for the financial support of this project and the management and performance of the project. ReferencesH. J. Kim, I. C. Bang and J. Onoe,
“Characteristic stability of bare Au-water nanofluids fabricated by pulsed laser ablation in liquids,”
Opt. Lasers Eng., 47
(5), 532
–538
(2009). http://dx.doi.org/10.1016/j.optlaseng.2008.10.011 OLENDN 0143-8166 Google Scholar
T. E. Itina,
“On nanoparticle formation by laser ablation in liquids,”
J. Phys. Chem. C, 115
(12), 5044
–5048
(2011). http://dx.doi.org/10.1021/jp1090944 1932-7447 Google Scholar
Z. Yan and D. B. Chrisey,
“Pulsed laser ablation in liquid for micro-/nanostructure generation,”
J. Photochem. Photobiol. C, 13
(3), 204
–223
(2012). http://dx.doi.org/10.1016/j.jphotochemrev.2012.04.004 1389-5567 Google Scholar
V. Amendola and M. Meneghetti,
“What controls the composition and the structure of nanomaterials generated by laser ablation in liquid solution?,”
Phys. Chem. Chem. Phys., 15
(9), 3027
–3046
(2013). http://dx.doi.org/10.1039/c2cp42895d PPCPFQ 1463-9076 Google Scholar
A. Menéndez-Manjón, P. Wagener and S. Barcikowski,
“Transfer-matrix method for efficient ablation by pulsed laser ablation and nanoparticle generation in liquids,”
J. Phys. Chem. C, 115
(12), 5108
–5114
(2011). http://dx.doi.org/10.1021/jp109370q 1932-7447 Google Scholar
V. Amendola, S. Polizzi and M. Meneghetti,
“Laser ablation synthesis of gold nanoparticles in organic solvents,”
J. Phys. Chem. B, 110
(14), 7232
–7237
(2006). http://dx.doi.org/10.1021/jp0605092 JPCBFK 1520-6106 Google Scholar
S. Eustis and M. A. El-Sayed,
“Determination of the aspect ratio statistical distribution of gold nanorods in solution from a theoretical fit of the observed inhomogeneously broadened longitudinal plasmon resonance absorption spectrum,”
J. Appl. Phys., 100
(4), 044324
(2006). http://dx.doi.org/10.1063/1.2244520 JAPIAU 0021-8979 Google Scholar
S. Link and M. A. El-Sayed,
“Spectral properties and relaxation dynamics of surface plasmon electronic oscillations in gold and silver nanodots and nanorods,”
J. Phys. Chem. B, 103
(40), 8410
–8426
(1999). http://dx.doi.org/10.1021/jp9917648 JPCBFK 1520-6106 Google Scholar
V. Amendola and M. Meneghetti,
“Size evaluation of gold nanoparticles by UV–Vis spectroscopy,”
J. Phys. Chem. C, 113
(11), 4277
–4285
(2009). http://dx.doi.org/10.1021/jp8082425 1932-7447 Google Scholar
E. D. Palik, Handbook of Optical Constants of Solids, Academic Press, New York
(1985). Google Scholar
H. Hövel et al.,
“Width of cluster plasmon resonances: Bulk dielectric functions and chemical interface damping,”
Phys. Rev. B, 48
(24), 18178
–18188
(1993). http://dx.doi.org/10.1103/PhysRevB.48.18178 PRBMDO 0163-1829 Google Scholar
W. Haiss et al.,
“Determination of size and concentration of gold nanoparticles from UV-Vis spectra,”
Anal. Chem., 79
(11), 4215
–4221
(2007). http://dx.doi.org/10.1021/ac0702084 ANCHAM 0003-2700 Google Scholar
K. Yamada, K. Miyajima and F. Mafuné,
“Thermionic emission of electrons from gold nanoparticles by nanosecond pulse-laser excitation of interband,”
J. Phys. Chem. C, 111
(30), 11246
–11251
(2007). http://dx.doi.org/10.1021/jp0730747 1932-7447 Google Scholar
|

