
|
|
1.BackgroundIn 2016, an estimated 1,685,210 new cases of cancer will be diagnosed in the United States and 595,690 people will die of the disease. The number of people living beyond a cancer diagnosis reached nearly 14.5 million in 2014 and is expected to rise to almost 19 million by 2024.1 Several key methods are in use to detect malignant tumors. However, those methods are either extremely invasive (as in the case of a biopsy or endoscopy), release extensive amount of ionizing radiation (as in the case of medical radiography), or high cost and cumbersome (as in the case of MRI and most medical radiography methods). In addition, those methods are used solely for diagnosis or monitoring of cancer and do not enable treatment of cancer. To overcome the disadvantages of those diagnosis methods, magnetic nanoparticles (MNPs) are suggested. MNPs, in their super paramagnetic phase, are small particles at the size range of 1 to 100 nanometers and are made from ferromagnetic materials, usually magnetite () or maghemite (). MNPs are already used for several medical applications, especially as contrast agents in MRI.2–4 One interesting property of MNPs is their ability to generate acoustic waves when a magnetic field in the temporal shape of a square wave (of tens of kilohertz) is applied on them.5,6 Another important property of MNPs is their ability to dissipate heat when an alternating magnetic field in higher frequencies is applied on them.7 This combination of properties allows diagnosis and treatment in the same short-time interval with hyperthermia as a treatment. Hyperthermia is a therapy in which the cancerous tissue is exposed to a temperature range of 42°C to 47°C to damage and kill cancer cells. This temperature range appears to produce a set of cytotoxic lesions in cells involving activation energies in the range required for protein denaturation.8 The approach of using hyperthermia in this temperature range with or without accompanying modalities remains highly promising in terms of favorable biological properties.9–11 The utility of this heating range for cancer treatment has been proven 12,13 and can be extended to deeply located tumors using the proposed method. Hyperthermia treatments are especially valuable, since, in addition to their therapeutic value, they increase the effectiveness of the traditionally used methods, such as radiotherapy and chemotherapy. Combined with those methods, the hyperthermic session increases cancer cell sensitivity to the effects of the combined treatment,14,15 thus increasing survivability and improving the prognosis. Previous works utilized the MNPs ability to dissipate heat for induction of focused and specific hyperthermic treatment for cancer.16–19 We have demonstrated the possibility of detecting tumors20 and also developed a method of magnetoacoustic detection and localization of tumors using MNPs.6 Acoustical noise in tissue is much lower than the thermal one, so we have applied our acoustical detection method in this study while leaving the thermal imaging for tumor assessment and temperature evaluation at the tumor area. A combined method for diagnosis and treatment at the same session may enable early treatment of cancer and therefore improve patient survivability. However, currently, such a method for a point of care application is not readily available. A review paper by Yezhelyev et al.21 describes some methods that utilize nanoparticles as a specific marker, a vehicle for a potential use for drug delivery (and not used as the treatment agent by itself) and as a contrast agent for CT or MRI for post treatment imaging and not for real time and point of care method. MNPs can be potentially used to create a combined diagnosis and treatment method, based on acoustic detection and focused hyperthermic treatment. Magneto-opto-acoustic imaging, both in tissue like phantoms22 and in vivo in breast imaging,23 was presented. However, the nanoparticles were not localized but only imaged. They were also not used for thermal treatment. The objective of this paper is, therefore, to demonstrate an elementary feasibility of using MNPs for both acoustic detection and hyperthermic treatment of cancer in vivo and that both can be done together within a short-time interval. The use of MNPs for detection of tumors and hyperthermic treatment of cancer will be described and demonstrated in vitro and in vivo. In addition, a novel method for a thermographic monitoring of tumor development is implemented in this work. 2.MethodsMagnetite () nanocrystals coated with oleic acid were synthesized according to the process described by Fried et al.24 The nanocrystals were dissolved in hexane, and in order to minimize oxidation, were kept in a glove box under a nitrogen atmosphere. In order to have a biocompatible MNP solution, a new procedure was developed for dispersing the MNPs in water. meso-2,3-Dimercaptosuccinic acid (DMSA) is known to be a good water dispersant for iron oxide nanoparticles.25 DMSA molecules () were dissolved in ultrapure water (, ). The desired basic pH was adjusted by adding a solution of ammonium hydroxide (). Oleic acid-coated MNPs dispersed in hexane () were combined with the aqueous DMSA solution and 20 mL of acetone, and were stirred in a closed bottle for 48 h. The acetone was added to reduce the surface tension at the interface between water and hexane.26 As soon as a precipitate was formed at the bottom of the bottle, the stirring was stopped, and all the yellow colored remaining solution was removed from the bottle. Finally, ultrapure water was slowly added to dissolve the DMSA-coated magnetite nanoparticles. A sonication bath was used for full dissolution. The solution was then partially vaporized in a rotary evaporator to increase its concentration. After the solution volume was reduced, its iron concentration was measured using a thermal gravimetric analysis machine (TGA-5000). of MNP solution was heated up to 510°C for 45 min. The amount for iron oxide at the end of the heating process was 5.405 mg. Hence, the original MNP concentration was , i.e., w/w. Acoustic stimulation was performed using the same apparatus described by Steinberg et al.6 The distance between the two coils was 15 cm and stimulation frequency of the square wave was 35 kHz with the current source set to 10 A. An acoustic signal was acquired using a Type 8103 hydrophone and a Nexus model 2692-0S1 amplifier (Brüel&Kjær, Nærum Denmark). The amplifier’s band-pass filter was set between 10 Hz and 100 kHz and the amplifier’s gain was set to . The amplifier was connected through a 30-dB attenuator to a spectrum analyzer (Signal Hound© USB-SA44D, La Center, Washington). The spectrum analyzer was connected to a computer and acquisition parameters were controlled by the Signal Hound software. The center frequency was set to 103 kHz, the resolution bandwidth was set to 6.5 Hz, and every measurement was averaged more than five sweeps. Ultrasound gel (Aquasonic Clear®) was used between hydrophone and tissue. Setup for in vivo acoustic measurements is presented in Fig. 1(a). In vitro validation of the MNPs was also conducted prior to this in vivo validation (results are not presented in this paper). Fig. 1(a) Setup for in vivo acoustic measurements. (b) Setup in vivo thermal measurements and hyperthermic treatment.  In order to induce a high-frequency magnetic field, an industrial 3 kW inductive heating system (HFI3 kW; water cooling system included; RDO induction L.L.C., Washington, New Jersey) was used. The system frequency was set to 295 kHz. The thermal images were captured using a ThermoVision A40 (FLIR©, Boston, Massachusetts) thermal camera. This camera can detect thermal differences as low as 0.08°C, with a spatial resolution of 1.3 mrad, and produces thermal images of . Images in the visible spectrum were taken by a Panasonic© DMC-ZS10 Lumix camera (14 megapixels) for the first experiment, and by a Samsung© I9300 Galaxy S3 (8 megapixels and autofocus) for the second experiment. Setup for in vivo thermal measurements and hyperthermic treatment is presented in Fig. 1(b). of the MNP solution was poured into a thermally isolated Eppendorf tube. The tube was positioned so its bottom was in the center of the radio frequency (RF) generator’s current loop (where the magnetic field is highest). Temperature was measured by the thermal camera positioned above the tube. In order to calculate specific absorption rate (SAR)(power dissipation per a unit of mass), a MATLAB® (Mathworks, Natick, Massachusetts) curve fitting tool was used. Temperature was measured by the thermal camera positioned 45 cm above the tube. Eight C57BL/J mice, all males, were each injected beneath the skin (abdominal dorsal region) with Lewis lung carcinoma (LLC) cells.27 Five mice went through the detection and treatment procedure as described below, while three mice were the control group (tumor injection only). Mice were treated only after tumor volume had exceeded , which happened 8 days on average after injection. Mice were anesthetized by injection of Xylazine () and Ketamin (). After being anesthetized, each of the mice was positioned between the coils, so the tumor was on the line between their centers. The acoustic measurement was performed 0.5 cm away from the tumor. The tumor was then injected with of MNPs solution and the acoustic measurement was performed again at the same point, so we could compare between the signal with and without the MNPs. After the acoustic measurement, each mouse was taken to the RF generator for treatment. Treatment duration was 6 min for two mice and 8 min for three mice. Field strength was while field frequency was 295 kHz. During the treatment, the mouse was thermally isolated from the coil itself and was positioned so that the tumor was in the center of the coil. The thermal camera was placed 45 cm above the mouse to observe thermal changes on the mouse skin. In order to estimate their volume (and therefore to monitor their development) tumor size was measured every few days by a caliper. Mice were sacrificed when either tumor length or width exceeded 20 mm. In order to further demonstrate the efficacy of the hyperthermic treatment, a second experiment was conducted. Nine C57BL/J mice (eight females and three males) were each injected beneath the skin (abdominal dorsal region) with LLC cells. Six (four females and two males) mice went through the treatment procedure described next, while five mice (four females and one male) were the control group (tumor injection and MNP solution injection only). Mice were treated only after tumor volume had exceeded , which happened 13 days on average after injection. Mice were anesthetized by injection of Xylazine () and Ketamin (). After being anesthetized, the tumor was then injected with of MNPs solution and each mouse was taken to the RF generator for treatment. Treatment duration was 10 min for all treated mice. Field strength was while field frequency was 295 kHz. During the treatment, the mouse was thermally isolated from the coil itself and was positioned so that the tumor was in the center of the coil. The thermal camera was placed 45 cm above the mouse to observe thermal changes upon mouse skin. In order to estimate their volume (and therefore to monitor their development), tumors were measured every few days by a caliper. Mice were sacrificed when either tumor length or width exceeded 20 mm. Animal care and experiments were carried out in accordance with the guidelines of the Israeli Council for Animal Experimentation. The temperature difference between the tumor and the surrounding healthy tissue was shown in the past to be correlated to the aggressiveness of the tumor and to be affected by its treatment.28–30 Therefore, during the second experiment, the thermal camera was also used to monitor the temperatures of the tumors and the surrounding tissues during the duration of the experiment. This was done to gather information regarding the underlying processes inside the tumors. Each tumor was imaged weekly during the entire experiment. The surroundings of each tumor were shaved prior to the measurements, as much as tumor state allowed. Each image was analyzed using the thermal camera software (ThermaCAM Researcher Professional, FLIR, Boston, Massachusetts) and MATLAB® (Mathworks, Natick, Massachusetts). The tumor was identified in the thermal images by comparison to the visual images of the mice. Tumor temperature was defined as the minimal temperature inside the tumor area. Healthy tissue temperature was evaluated from the shaved region surrounding the tumor. Tumor temperature difference was calculated by subtracting the healthy tissue temperature from the temperature of the tumor. The previous research has shown that the temperature difference is partially a result of the tumor’s extruding shape from the skin surface and that the expected tumor temperature difference as a result of tumor shape can be approximated using the formula where is the lump’s height, is the surface area, is the volume, and is the aperture angle.31For the calculations in this study, tumor height was defined as the measured length from the deepest part of the tumor to the skin (since the tumors are very close to the skin surface). Tumor radius was assumed to be the average of the other two measurement dimensions (the length and the width). The functional temperature difference () is defined by subtracting the expected temperature difference due to shape (), from the measured temperature difference (). This temperature difference approximately represents the effect of nongeometrical contributors to the temperature difference, mainly the metabolism and perfusion.31 The model described in the literature assumes a single ellipsoid tumor. Consequently, tumors with irregular shapes or multiple cores were excluded from the thermal analysis. It was, therefore, performed on the tumors of four treated and five untreated mice. Although the tumors were thermally imaged throughout the entire experiment, only those that were taken from the first 15–17 days after treatment were used. This was due to the formation of wounds on the surface of the tumors, possibly caused by their large size. Since thermal imaging indicates only the surface temperature, the measured tumor temperature would have represented the wound temperature (composed of exposed internal tissues and blood clots) and not the tumor temperature, affected by its internal status. After the exclusion of measurements performed on tumors with visible wounds, the total number of analyzed images was 3–4 for each mouse. 3.ResultsThe results of the in vivo acoustic recordings are presented in Fig. (2). For frequencies between 103.46 and 103.54 kHz, the acoustic signal of the tumor with MNPs is higher than the acoustic signal of the tumor without MNPs. Overall, the average MNPs attributed acoustic signal from the five mice was 4.36 dB (standard deviation was ). Fig. 2In vivo MNPs attributed acoustic signal. The power of the recorded signals of the five mice of the first experiment. For each mouse, the power of recorded signals before the MNPs injection (black) and after it (red) are shown. The average signal of the five mice was before the MNPs injection and after it. 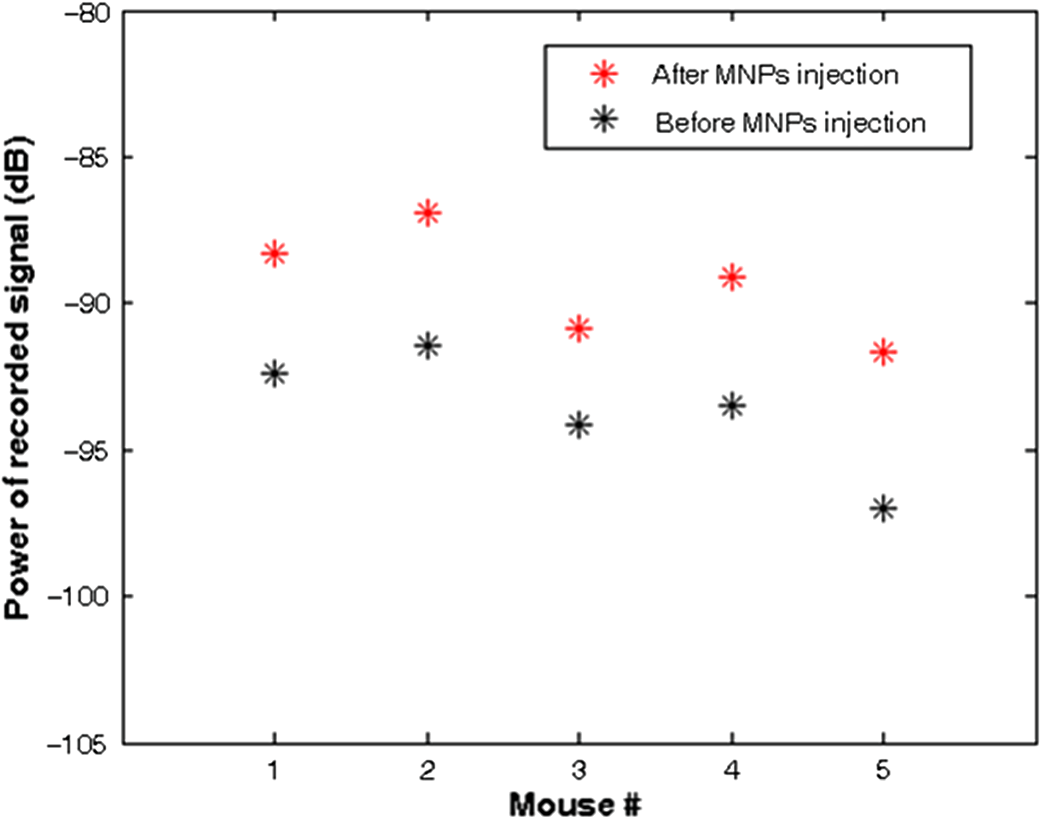 An example of in vitro heat up of MNPs is presented in Fig. 3(a). During the 3 min of the magnetic field application, the solution temperature increased by almost 16°C. SAR for 12 different square field strengths is presented in Fig. 3(b). These results show good correspondence with the known expected linear behavior16 as adjusted for this fit is equal to 0.947 (slope equal to ). Fig. 3In vitro thermal results. (a) Heating of MNPs solution (). (b) SAR versus square magnetic field dependence. Measurements (blue asterisks) and the linear fit (black dashed line) are shown. Fit slope is and adjusted of fit is 0.947. 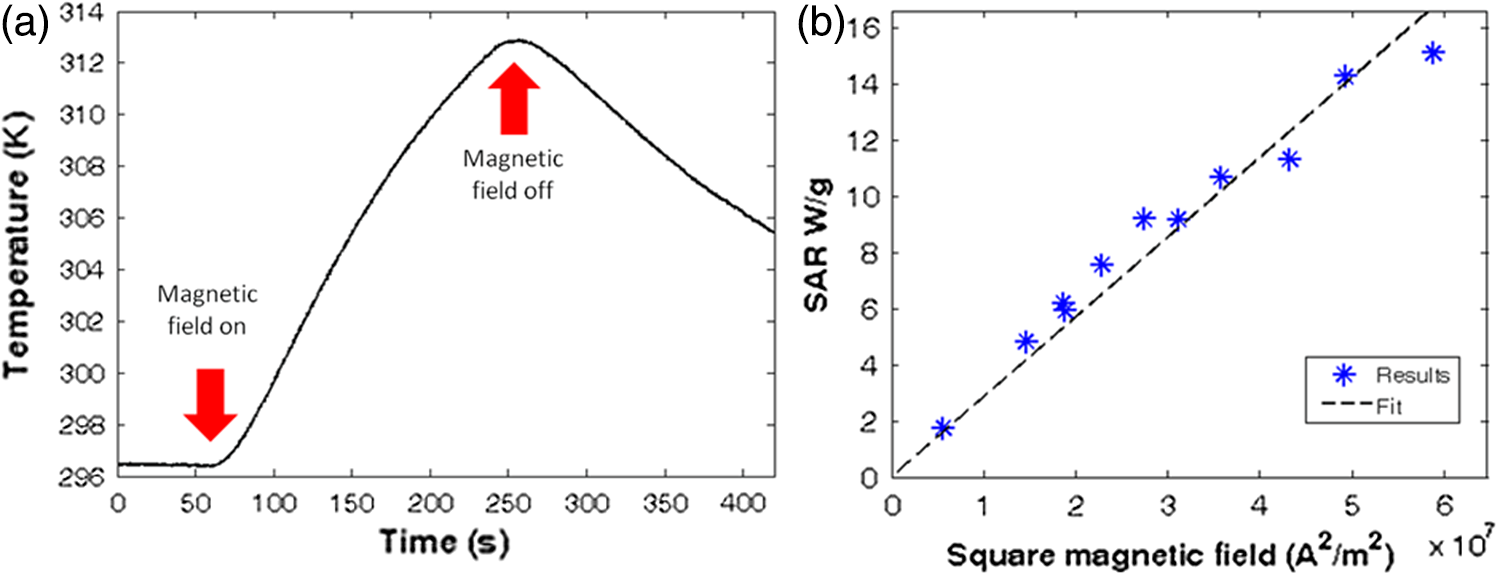 Tumor development, for both 6 and 8 min, in treated and untreated mice of the first experiment is presented in Fig. 4(a). While the average tumor volume at the day of the treatment was approximately the same for the two groups, 5 days after the treatment the average tumor volume of the untreated mice was three times larger than the average tumor volume of the treated mice. Two tailed, unpaired -test for tumor volumes was also conducted between the two groups and yielded a -value of 1.6% for 5 days after the treatment. However, -value for 9 days after the treatment increased to 6.1% implying that this treatment retarded tumor growth for a few days only. The second experiment was conducted to check the efficacy when treatment duration was longer (10 min instead of 6 and 8 min). In addition, untreated mice were injected with MNP solution to their tumors. Tumor development for both treated and untreated mice is presented in Fig. 4(b). As in the first experiments, average tumor volumes at the day of the treatment were approximately the same for the two groups. After 2 days, slight differences were already observed as the average tumor volume of the untreated mice was 1.5 times larger than average tumor volume of the treated mice. Seven days after treatment, this difference increased to a ratio of 2 but decreased back to 1.5 for 14 days after treatment. Two tailed, unpaired -test for tumor volumes was also conducted between the two groups and yielded a -value of 2.9% for 7 days after the treatment and -values of 41.6% and 34.2% for 2 and 14 days, respectively. This strengthens the assumption from the first experiment suggesting that the treatment was efficient for a few days only. Fig. 4Hyperthermic treatment results. (a) The development of tumor volumes for treated () and untreated () mice of the first experiment. Treatment duration was 6 min for two mice and 8 min for three mice. (b) The development of tumor volumes for treated () and untreated () mice of the second experiment. Treatment duration was 10 min for all six mice. Inset: magnification of the period of 8 days after treatment. For both graphs, error bars represent standard error, which is the standard deviation multiplied by a factor of 1.96 (95% conference level) and divided by square root of the sample size (axis titles are the same as the outset). 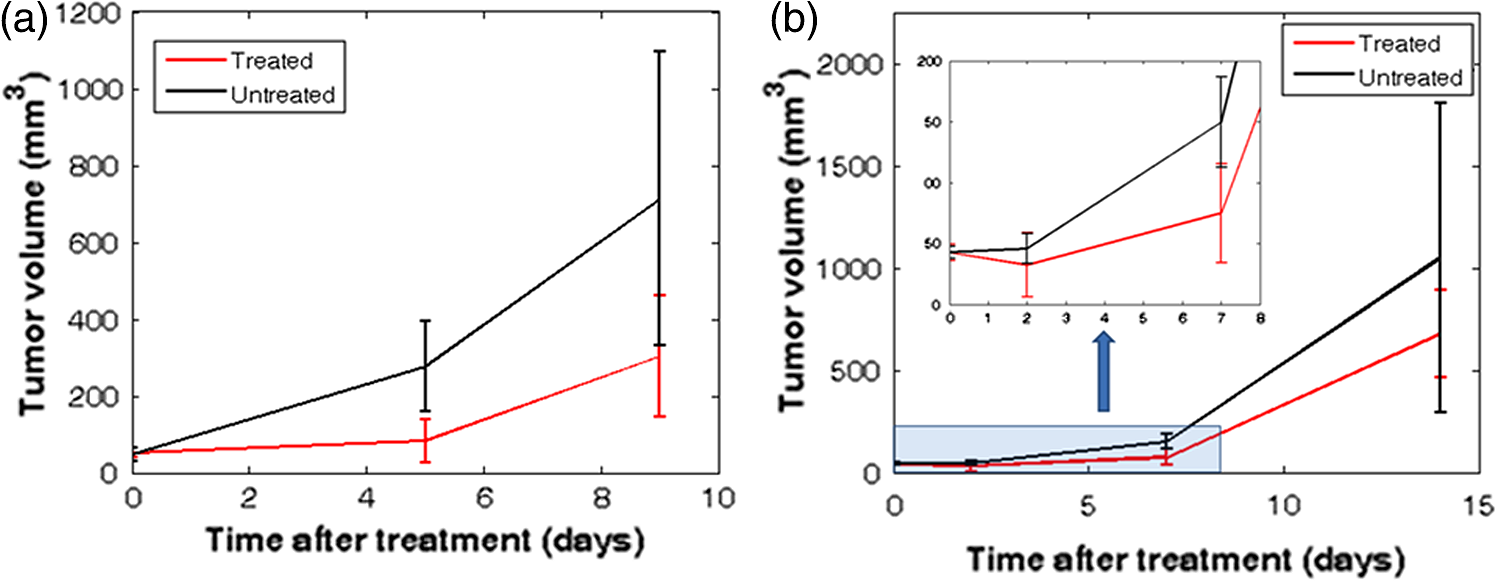 In order to examine the relation between treatment duration and its effect on the tumor, the average growth rate (AGR) between and (in days) was defined as where and are the tumor volumes () in and , respectively. For one mouse in the second experiment, the tumor was not observed 7 days after treatment. Since would yield , AGR for this mouse was calculated with , which is about the minimum measurable tumor volume.Figure 5(a) represents AGR for a period of 5 days after treatment for the eight mice of the first experiment. AGR of each mouse versus the tumor volume is shown at the day of the treatment. The untreated mice presented similar AGRs of 0.15 1/day, whereas the mice treated for 6 min presented lower AGRs of 0.05 and 0.1 1/day. The mice treated for 8 min presented even lower AGRs between 0.01 and 1/day. A trend can be seen for mice of the same treatment duration; the smaller the initial tumor volume, the lower the AGR. This is compatible with the previous observations showing better treatment results when applied to smaller tumors.32–34 Next, the results of the second experiment were added to the results of the first experiment. The results of both experiments are shown in Fig. 5(b) (in the second experiment, AGR was calculated for 7 days after treatment). Here, it can be seen that the untreated mice of the second experiment showed lower than AGR compared with the untreated mice of the first experiment. In addition, the treated mice of the second experiment showed, as expected, lower than AGRs compared with the untreated mice of this experiment. However, AGRs of treated mice from the second experiment are widely distributed between AGRs similar to ones obtained for the 6-min treatment and AGR lower than the ones obtained for the 8-min treatment. Fig. 5Analysis of hyperthermic treatment results. AGR of each mouse versus the tumor volume is shown at the day of the treatment. (a) AGR calculated 5 days after treatment for the eight mice of the first experiment. (b) AGR for a period of 5 days after treatment for the eight mice of the first experiment and AGR for a period of 7 days after treatment for the 11 mice of the second experiment. 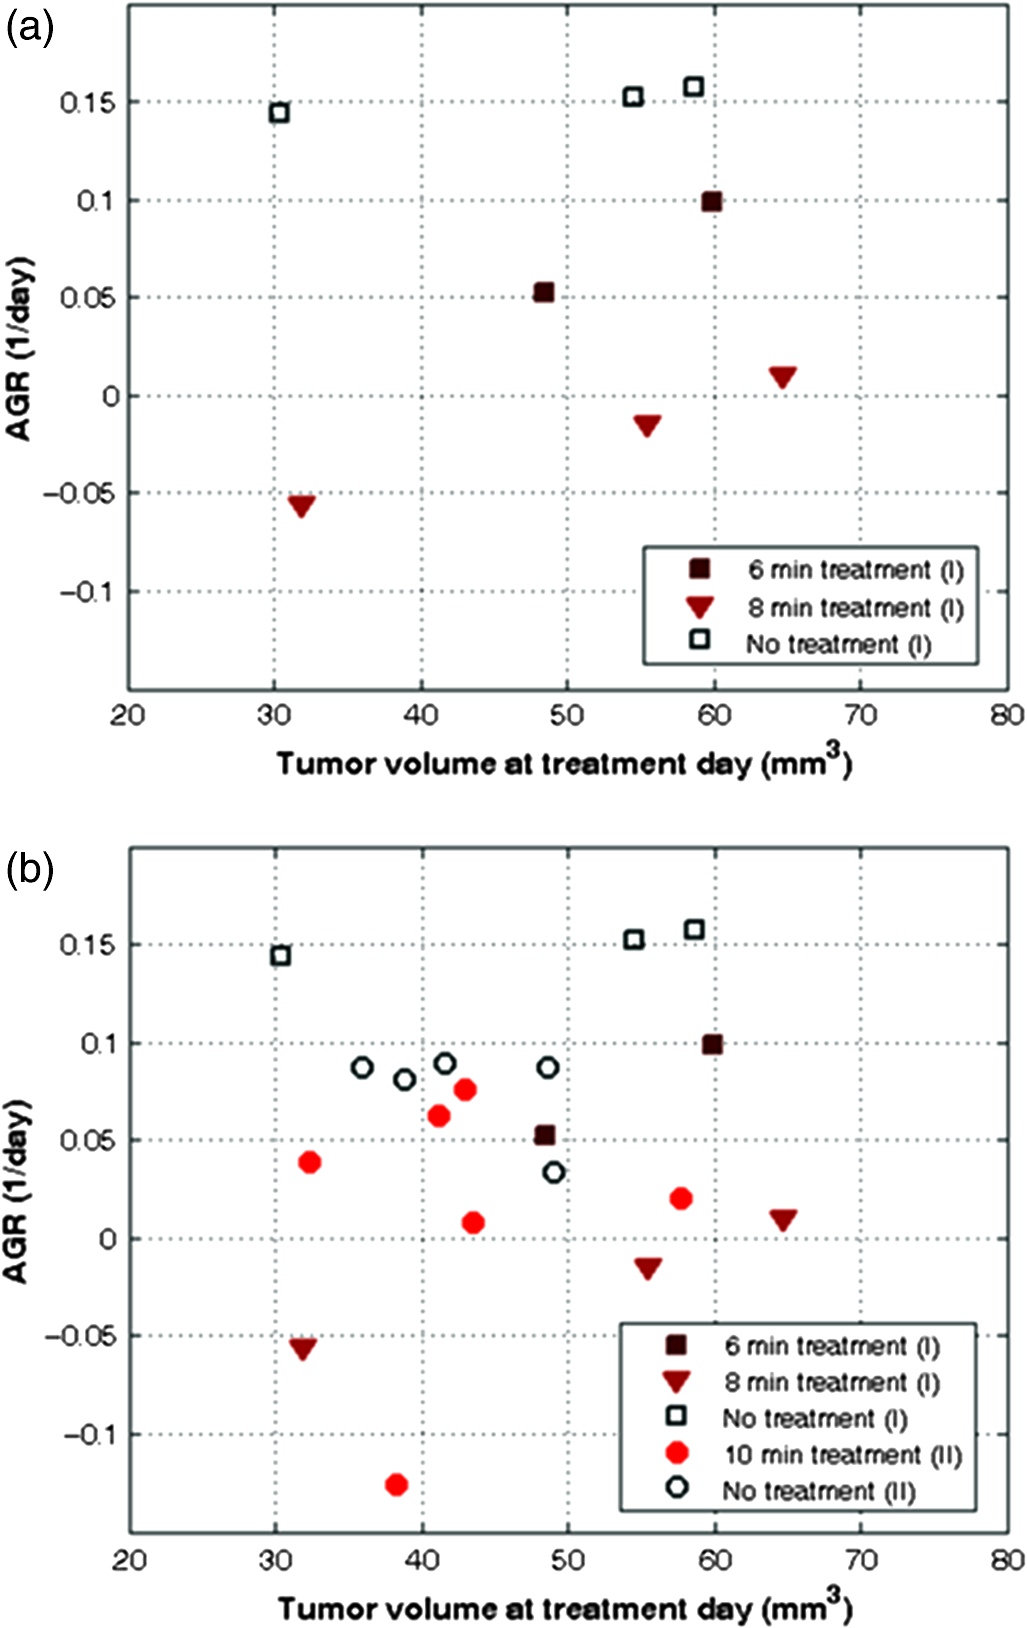 In order to assess the internal processes inside the tumors, they were thermally imaged several times during the second experiment. For each measurement, was calculated, as described before, using the tumor caliper measurements. Figure 6(a) shows the changes in as a function of time since the treatment. Every dot in the graph represents a single measurement of one of the tumors. A linear fit was calculated for the treated and untreated tumors. As this figure shows, is similar for both groups during the first few days after the treatment was given (with the exception of one relatively warmer treated tumor). The average shows a slight decrease after a week for the untreated tumors (as seen from the trend line) and a bigger decrease for the treated tumors. It can be seen that after a week, is lower for the treated tumors than for the untreated tumors. This finding is in accordance to previous experimental results29 and suggests that the treatment was successful, since initiated necrotic processes can lead to reduced metabolic and perfusion rates and therefore to reduced tumor temperature. The similarity between of the two groups, at the first few days after the treatment, may indicate that the cellular response is delayed by a few days and not immediate. Figure 6(b) shows as a function of tumor volume. Each dot in the graph represents a single measurement of one of the tumors. Since begins to change only after the first few days, these measurements are marked differently in this figure (“treated—days 1–3”), in order to differentiate them from later measurements. As this figure shows, there is an average difference of approximately 1.5°C between the of the “treated—days 8–17” and the untreated tumor groups. As shown in Fig. 6(a), this indicates that the treatment effect on the temperature difference was not immediate. The cooling of the tumor suggests that the treatment had an internal effect on tumor state. A thermography and visible spectrum images of a tumor and its surroundings are presented in Figs. 6(c) and 6(d), respectively. Fig. 6(a) changes during the experiment as a function of time since treatment (treated and treated tumor groups and the respective linear trend lines). (b) changes during the experiment as a function of tumor volume (logarithmic scale). Treated tumor group measurements are divided into two subgroups, depending on measurement day. (c) Thermography image of a tumor (dashed circle) and its surroundings. (d) Visible spectrum image of a tumor and its surrounding. Bar length in both (c) and (d) is 2 cm. 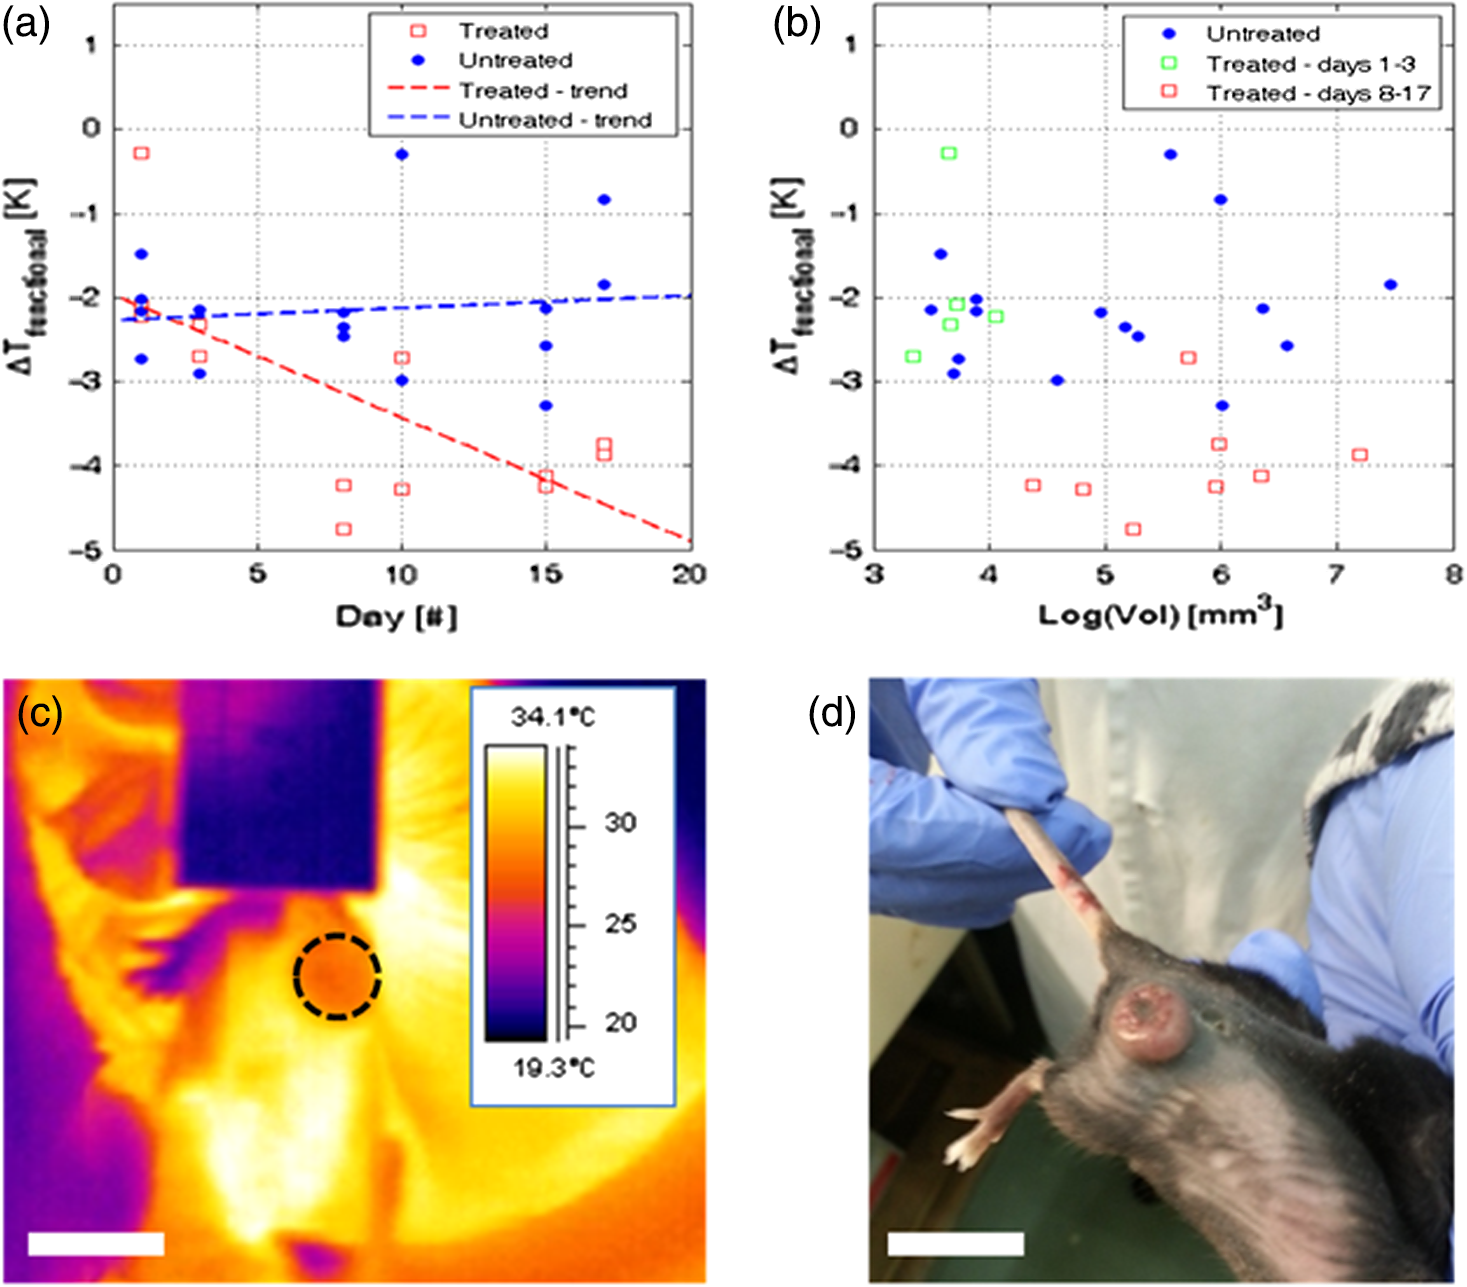 4.DiscussionBoth in vitro and in vivo acoustic measurements show feasibility for detecting tumors using MNPs. Moreover, magnetoacoustical detection and localization is a base for work, which is done in the lab regarding approximation of the temperature at the tumor location by using a combination of localization and thermal imaging. However, there are several ways to improve the acoustic measurements enabling the detection of smaller tumors, in greater depths and with higher signal-to-noise ratio (SNR). First, the stimulation magnetic signal should be narrower in the frequency domain. By narrowing its frequency band, the measured acoustic signal is expected to behave accordingly, which will result in higher SNR of the acquired signal. Moreover, if stimulation is narrower in the frequency domain, frequency sweeping would take less time, and will enable better averaging of recorded data. It should be noted that other temporal shapes of magnetic field can be successfully used for the generation of the acoustic signal from MNPs, and may be implemented in a future work based on the presented method.35,36 Second, a more suitable transducer can be used for acquiring the acoustic signal as the transducer used in this experiment was a hydrophone that is most suitable for underwater measurement. In the in vivo measurements, the contact area between the transducer and the mouse skin was rather small. Therefore, future improvement should consider the use of other transducers more suitable for in vivo measurements. Third, a future improvement might include the use of an array of transducers. Using such an array may enable not only the presence of a tumor but also could provide information regarding its morphology. Although treatment affected tumor growth in the days after treatment in both experiments, there are several observations that should be discussed. One observation is that the treatment affected tumor growth for only a few days. Therefore, in order to further demonstrate its therapeutic efficacy, future experiments should examine the effect of treatment when given in several sessions of a few days apart. Another observation is that mice treated for 10 min, showed a higher growth rate compared with mice treated for eight and even 6 min. Although this observation can be explained by gender differences between the two experiments, a more reasonable explanation can be that those mice were overdosed by longer treatment duration. Finally, untreated mice in the second experiment showed lower AGR than the untreated mice in the first experiment. One explanation for this can be the effect of either the MNP solution or its injection. However, it is more likely that this was caused by the variability of the LLC cells and animal models since a similar difference in AGRs between the two untreated groups was also observed before the injection of the MNPs solution. Thermal imaging was used to monitor tumor state during the second experiment. This method is potentially very useful for noninvasive monitoring since as the tumor evolves, its temperature is expected to rise (as seen in human tumors) due to increased metabolic and perfusion rates. A successful treatment is expected to damage the tumor and therefore to reduce these rates. However, as shown in previous studies, the tumor temperature in animal model studies shows a different dependence on tumor volume, when compared to human model studies.31 The tumors are cooler than their surrounding tissues and this temperature difference may increase as the tumor grows. A possible explanation for these observations was proposed and is supported by both phantom experiments and simulations: tumors in animal models are often transplanted, leading to increased tumor growth rates when compared to spontaneously occurring human tumors. Since the tumors are transplanted close to the skin surface, the increased growth results in a visible lump. This tumor geometry reduces tumor temperature due to its distance from the animal body and due to cooling caused by the larger surface area. This reduced temperature, therefore, masks the underlying thermal processes inside the tumor. The method presented for calculating the tumor temperature difference caused by the tumor’s functional state alone () allows observation of these internal processes and the possible damage induced by the treatment. measurements during the second experiment suggest that the damage due to the treatment reduced the metabolic or perfusion rates of the tumor. That thermal effect of this damage appears to be delayed by several days after the treatment. In order to verify the cause of the temperature decrease, future experiments should include additional tests. Caliper volume measurements suggest a short period of inhabited tumor growth after the treatment, followed by regular growth rates. However, the thermal effect was maintained for a longer time period, of at least 17 days. A possible explanation for this difference is that the treatment causes damage to the tumor but does not destroy it entirely, allowing the tumor at its edges to continue its growth. In this case, histology tests performed at different times after the treatment may reveal that the necrotic core of the treated tumors is larger than the necrotic core of the untreated tumors. Another possible explanation is that the treatment causes mechanical damage to the tumor, thus changing its structure or its heat transfer properties. Histology tests can verify this scenario as well. These findings should be further validated in additional experiments, including more mice, corroborative tests, and possibly by using techniques such as atomic force microscopy.37,38 The effect of treatment duration should also be evaluated. It should also be noted that the calculated values of are low when compared to the previous research. This may be due to different settings in this experiment when compared to Tepper et al.,31 and should be explored to reduce possible errors. At the final stages of the experiment, wounds were formed on the tumor surface. Since the thermal camera can monitor only surface temperature, the exposure of different tissue types caused large errors in the temperature difference calculation. These measurements were, therefore, not used. Due to similar reasons, the tumors and their surroundings had to be shaved to avoid thermal masking by the fur. Although thermal monitoring of the tumor is useful, these limitations should be considered when incorporating this method to future experiments. Other improvements should be implemented to enable this method for clinical uses. First, since SAR of MNPs is affected by their size distribution, it can be improved if MNP synthesis is optimized. Higher SAR can be achieved by both theoretical and experimental investigation of different size distributions; obtaining higher SAR can help to reduce either the concentration of injected MNP solution, the strength of the magnetic field or both. Reducing the amount of the injected solution would be especially helpful, as the injection of the solution to the tumor in both experiments was challenging. More specifically, sometimes the volume of the solution had to be partitioned and injected in several places in the tumor causing undesired damages. Second, in this experiment, a simple one loop coil was used. The main drawback of such a configuration is that the high-strength magnetic field is confined to the center of the loop and decreases sharply farther away from it. Further developments of the method should consider the use of better field configurations with magnetic fields confined to a relatively large space (e.g., Helmholtz coils). In this experiment, DMSA-coated magnetite MNPs were directly injected to tumors. Future development of the method should consider actively targeting these MNPs. This can be done by conjunction of antibodies or ligands that show specificity to one or more type of cancer. Previous works showed that DMSA can be conjugated with antibodies such as Herceptin39 and HmenB140 known for their strong affinity to polysialic acids expressed in neuroblastoma, lung carcinoma, and Wilms tumors.41–43 Furthermore, it is suggested that this method could be utilized beyond its initial objective.44 In conclusion, although MNPs were lately considered as an ideal vehicle for multimodal and multifunctional applications,45 they so far required the complex conjugation of additional agents (e.g., fluorescent dyes, siRNA molecules, and anticancer drugs) to the MNPs to allow diagnosis and treatment of cancer.46–49 The system described here, however, utilizes the unique physical properties of biologically specific MNPs without the need to conjugate additional agents. It can, therefore, overcome drawbacks of current methods, be minimally invasive, low-cost, nonradiative, and should allow diagnosis, treatment and treatment monitoring in one session. AcknowledgmentsWe thank Margalit Efrati and Hila Confino for their assistance in the animal experiments. This research was supported by the Ministry of Science and Technology, Israel. ReferencesCancer Statistics, National Cancer Institute, National Institutes of Health, Bethesda, Maryland
(2016). Google Scholar
L. Babes et al.,
“Synthesis of iron oxide nanoparticles used as MRI contrast agents: a parametric study,”
J. Colloid Interface Sci., 212 474
–482
(1999). http://dx.doi.org/10.1006/jcis.1998.6053 Google Scholar
J. W. Bulte and D. L. Kraitchman,
“Iron oxide MR contrast agents for molecular and cellular imaging,”
NMR Biomed., 17 484
–499
(2004). http://dx.doi.org/10.1002/(ISSN)1099-1492 Google Scholar
N. Nitin et al.,
“Functionalization and peptide-based delivery of magnetic nanoparticles as an intracellular MRI contrast agent,”
J. Biol. Inorg. Chem., 9 706
–712
(2004). http://dx.doi.org/10.1007/s00775-004-0560-1 Google Scholar
A. Tsalach, I. Steinberg and I. Gannot,
“Tumor localization using magnetic nano-particles induced acoustic signals,”
IEEE Trans. Biomed. Eng., 2313
–2323
(2013). http://dx.doi.org/10.1109/TBME.2013.2286638 Google Scholar
I. Steinberg, M. Ben-David and I. Gannot,
“A new method for tumor detection using induced acoustic waves from tagged magnetic nanoparticles,”
Nanomedicine, 8 569
–579
(2012). http://dx.doi.org/10.1016/j.nano.2011.09.011 1743-5889 Google Scholar
L. D. Landau and E. M. Lifshitz, Electrodynamics of Continuous Media, Pergamon Press, London, England
(1960). Google Scholar
A. Westra and W. C. Dewey,
“Variation in sensitivity to heat shock during the cell-cycle of Chinese hamster cells in vitro,”
Int. J. Radiat. Biol. Relat. Stud. Phys. Chem. Med., 19 467
–477
(1971). http://dx.doi.org/10.1080/09553007114550601 Google Scholar
E. L. Jones et al.,
“The 70 kilodalton heat shock protein is an inhibitor of apoptosis in prostate cancer,”
Int. J. Hyperthermia, 20 835
–849
(2004). http://dx.doi.org/10.1080/02656730410001721807 Google Scholar
C. W. Song, H. Park and R. J. Griffin,
“Improvement of tumor oxygenation by mild hyperthermia,”
Radiat. Res., 155 515
–528
(2001). http://dx.doi.org/10.1667/0033-7587(2001)155[0515:IOTOBM]2.0.CO;2 Google Scholar
D. Tang et al.,
“Expression of heat shock proteins and heat shock protein messenger ribonucleic acid in human prostate carcinoma in vitro and in tumors in vivo,”
Cell Stress Chaperones, 10 46
–58
(2005). http://dx.doi.org/10.1379/CSC-44R.1 Google Scholar
R. D. Issels,
“Hyperthermia adds to chemotherapy,”
Eur. J. Cancer, 44 2546
–2554
(2008). http://dx.doi.org/10.1016/j.ejca.2008.07.038 Google Scholar
J. Van der Zee et al.,
“Comparison of radiotherapy alone with radiotherapy plus hyperthermia in locally advanced pelvic tumours: a prospective, randomised, multicentre trial. Dutch deep hyperthermia group,”
Lancet, 355 1119
–1125
(2000). http://dx.doi.org/10.1016/S0140-6736(00)02059-6 LANCAO 0140-6736 Google Scholar
J. M. C. Bull,
“An update on the anticancer effects of a combination of chemotherapy and hyperthermia,”
Cancer Res., 44
(10 supplement), 4853s
–4856s
(1984). Google Scholar
M. R. Manning et al.,
“Clinical hyperthermia: results of a phase I trial employing hyperthermia alone or in combination with external beam or interstitial radiotherapy,”
Cancer, 49 205
–216
(1982). http://dx.doi.org/10.1002/(ISSN)1097-0142 CANCAR 0008-543X Google Scholar
R. Hergt et al.,
“Maghemite nanoparticles with very high AC-losses for application in RF-magnetic hyperthermia,”
J. Magn. Magn. Mater., 270 345
–357
(2004). http://dx.doi.org/10.1016/j.jmmm.2003.09.001 Google Scholar
I. Hilger et al.,
“Magnetic nanoparticles for selective heating of magnetically labelled cells in culture: preliminary investigation,”
Nanotechnology, 15 1027
(2004). http://dx.doi.org/10.1088/0957-4484/15/8/029 NNOTER 0957-4484 Google Scholar
M. Johannsen et al.,
“Clinical hyperthermia of prostate cancer using magnetic nanoparticles: presentation of a new interstitial technique,”
Int. J. Hyperthermia, 21 637
–647
(2005). http://dx.doi.org/10.1080/02656730500158360 Google Scholar
M. Shinkai et al.,
“Targeting hyperthermia for renal cell carcinoma using human MN antigen-specific magnetoliposomes,”
Jpn. J. Cancer Res., 92 1138
–1145
(2001). http://dx.doi.org/10.1111/cas.2001.92.issue-10 Google Scholar
A. Levy et al.,
“A new thermography-based approach to early detection of cancer utilizing magnetic nanoparticles theory simulation and in vitro validation,”
Nanomed. Nanotechnol. Biol. Med., 6 786
–796
(2010). http://dx.doi.org/10.1016/j.nano.2010.06.007 1743-5889 Google Scholar
M. V. Yezhelyev et al.,
“Emerging use of nanoparticles in diagnosis and treatment of breast cancer,”
Lancet. Oncol., 7 657
–667
(2006). http://dx.doi.org/10.1016/S1470-2045(06)70793-8 Google Scholar
M. Qu et al.,
“Contrast-enhanced magneto-photo-acoustic imaging in vivo using dual-contrast nanoparticles,”
Photoacoustics, 2 55
–62
(2014). http://dx.doi.org/10.1016/j.pacs.2013.12.003 Google Scholar
M. Qu, M. Mehrmohammadi and S. Y. Emelianov,
“Sensing the delivery and endocytosis of nanoparticles using magneto-photo-acoustic imaging,”
Photoacoustics, 3 107
–113
(2015). http://dx.doi.org/10.1016/j.pacs.2015.08.004 Google Scholar
T. Fried, G. Shemer and G. Markovich,
“Ordered two-dimensional arrays of ferrite nanoparticles,”
Adv. Mater., 13 1158
–1161
(2001). http://dx.doi.org/10.1002/(ISSN)1521-4095 Google Scholar
Y.-W. Jun et al.,
“Nanoscale size effect of magnetic nanocrystals and their utilization for cancer diagnosis via magnetic resonance imaging,”
J. Am. Chem. Soc., 127 5732
–5733
(2005). http://dx.doi.org/10.1021/ja0422155 Google Scholar
N. Gaponik et al.,
“Efficient phase transfer of luminescent thiol-capped nanocrystals: from water to nonpolar organic solvents,”
Nano Lett., 2 803
–806
(2002). http://dx.doi.org/10.1021/nl025662w NALEFD 1530-6984 Google Scholar
T. Cooks et al.,
“Local control of lung derived tumors by diffusing alpha-emitting atoms released from intratumoral wires loaded with radium-224,”
Int. J. Radiat. Oncol. Biol. Phys., 74 966
–973
(2009). http://dx.doi.org/10.1016/j.ijrobp.2009.02.063 Google Scholar
W. C. Amalu et al.,
“Infrared imaging of the breast - an overview,”
The Biomedical Engineering Handbook. Medical Devices and Systems, CRC Press, Boca Raton
(2006). Google Scholar
M. Tepper et al.,
“Thermographic investigation of tumor size, and its correlation to tumor relative temperature, in mice with transplantable solid breast carcinoma,”
J. Biomed. Opt., 18 111410
(2013). http://dx.doi.org/10.1117/1.JBO.18.11.111410 Google Scholar
T. Yahara et al.,
“Relationship between microvessel density and thermographic hot areas in breast cancer,”
Surg. Today, 33
(4), 243
–248
(2003). http://dx.doi.org/10.1007/s005950300055 Google Scholar
M. Tepper, A. Shoval and I. Gannot,
“The effect of geometry on tumor thermal profile and its use in tumor functional state estimation,”
J. Biophotonics, 8
(3), 258
–264
(2015). http://dx.doi.org/10.1002/jbio.201400005 Google Scholar
D. J. Brenner,
“Dose, volume, and tumor-control predictions in radiotherapy,”
Int. J. Radiat. Oncol. Biol. Phys., 26 171
–179
(1993). http://dx.doi.org/10.1016/0360-3016(93)90189-3 Google Scholar
A. Eisbruch et al.,
“Dose, volume, and function relationships in parotid salivary glands following conformal and intensity-modulated irradiation of head and neck cancer,”
Int. J. Radiat. Oncol. Biol. Phys., 45 577
–587
(1999). http://dx.doi.org/10.1016/S0360-3016(99)00247-3 Google Scholar
J. Willner et al.,
“Dose, volume, and tumor control prediction in primary radiotherapy of non-small-cell lung cancer,”
Int. J. Radiat. Oncol. Biol. Phys., 52 382
–389
(2002). http://dx.doi.org/10.1016/S0360-3016(01)01823-5 Google Scholar
G. Hu and B. He,
“Magnetoacoustic imaging of magnetic iron oxide nanoparticles embedded in biological tissues with microsecond magnetic stimulation,”
Appl. Phys. Lett., 100 013704
(2012). http://dx.doi.org/10.1063/1.3675457 APPLAB 0003-6951 Google Scholar
D. Piao et al.,
“Magnetothermoacoustics from magnetic nanoparticles by short bursting or frequency chirped alternating magnetic field: a theoretical feasibility analysis,”
Med. Phys., 40 063301
(2013). http://dx.doi.org/10.1118/1.4804056 Google Scholar
G. Thomas et al.,
“Measuring the mechanical properties of living cells using atomic force microscopy,”
J. Vis. Exp.,
(76), e50497
(2013). http://dx.doi.org/10.3791/50497 Google Scholar
K. Haase and A. E. Pelling,
“Investigating cell mechanics with atomic force microscopy,”
J. R. Soc., 12 201409700
(2015). http://dx.doi.org/10.1098/rsif.2014.0970 Google Scholar
Y.-M. Huh et al.,
“In vivo magnetic resonance detection of cancer by using multifunctional magnetic nanocrystals,”
J. Am. Chem. Soc., 127 12387
–12391
(2005). http://dx.doi.org/10.1021/ja052337c Google Scholar
J.-H. Lee et al.,
“Dual-mode nanoparticle probes for high-performance magnetic resonance and fluorescence imaging of neuroblastoma,”
Angew. Chem., 118 8340
–8342
(2006). http://dx.doi.org/10.1002/(ISSN)1521-3757 Google Scholar
L. Daniel et al.,
“A nude mice model of human rhabdomyosarcoma lung metastases for evaluating the role of polysialic acids in the metastatic process,”
Oncogene, 20 997
–1004
(2001). http://dx.doi.org/10.1038/sj.onc.1204176 ONCNES 0950-9232 Google Scholar
D. F. Figarella-Branger, P. L. Durbec and G. N. Rougon,
“Differential spectrum of expression of neural cell adhesion molecule isoforms and L1 adhesion molecules on human neuroectodermal tumors,”
Cancer Res., 50
(19), 6364
–6370
(1990). Google Scholar
R. Seidenfaden et al.,
“Polysialic acid directs tumor cell growth by controlling heterophilic neural cell adhesion molecule interactions,”
Mol. Cell. Biol., 23 5908
–5918
(2003). http://dx.doi.org/10.1128/MCB.23.16.5908-5918.2003 Google Scholar
S. Zhang et al.,
“Preparation of anti-human cardiac troponin I immunomagnetic nanoparticles and biological activity assays,”
Colloids Surf. B, 55 143
–148
(2007). http://dx.doi.org/10.1016/j.colsurfb.2006.11.041 Google Scholar
R. Thomas, I.-K. Park and Y. Jeong,
“Magnetic iron oxide nanoparticles for multimodal imaging and therapy of cancer,”
Int. J. Mol. Sci., 14 15910
–15930
(2013). http://dx.doi.org/10.3390/ijms140815910 Google Scholar
Y. Chen et al.,
“Development of an MRI-visible nonviral vector for siRNA delivery targeting gastric cancer,”
Int. J. Nanomed., 7 359
–368
(2012). http://dx.doi.org/10.2147/IJN.S24083 Google Scholar
J. H. Lee et al.,
“All-in-one target-cell-specific magnetic nanoparticles for simultaneous molecular imaging and siRNA delivery,”
Angew. Chem., 48 4174
–4179
(2009). http://dx.doi.org/10.1002/anie.v48:23 Google Scholar
S. Santra et al.,
“Drug/dye-loaded, multifunctional iron oxide nanoparticles for combined targeted cancer therapy and dual optical/magnetic resonance imaging,”
Small, 5 1862
–1868
(2009). http://dx.doi.org/10.1002/smll.v5:16 SMALBC 1613-6810 Google Scholar
M. K. Yu et al.,
“Drug-loaded superparamagnetic iron oxide nanoparticles for combined cancer imaging and therapy in vivo,”
Angew. Chem., 47 5362
–5365
(2008). http://dx.doi.org/10.1002/anie.v47:29 Google Scholar
BiographyIsrael Gannot is a professor of biomedical engineering at Tel-Aviv University and a research professor in the Department of Electronic and Computer Engineering at Johns Hopkins University. His research interests are multimodal approach, nanoparticles based image treatment and monitoring of diseases, and optical fibers for surgical and sensing applications and translational research. He has also founded Opticul Diagnostics, an in vitro diagnostics company that is developing instant bacteria detection instruments in a clinical setting. |


